Earth's energy imbalance (EEI) at the top of the atmosphere (TOA) is a key climate system metric but has only been well-observed for the past twenty years, a period of strong anthropogenic greenhouse gas forcing. This short record limits our understanding of low-frequency energy budget variability
Loeb et al. (2020) demonstrated the feasibility of skillfully reconstructing TOA radiation and thus Earth's energy budget given sea surface temperatures and historical forcings, which are physically linked through cloud properties and surface albedo.
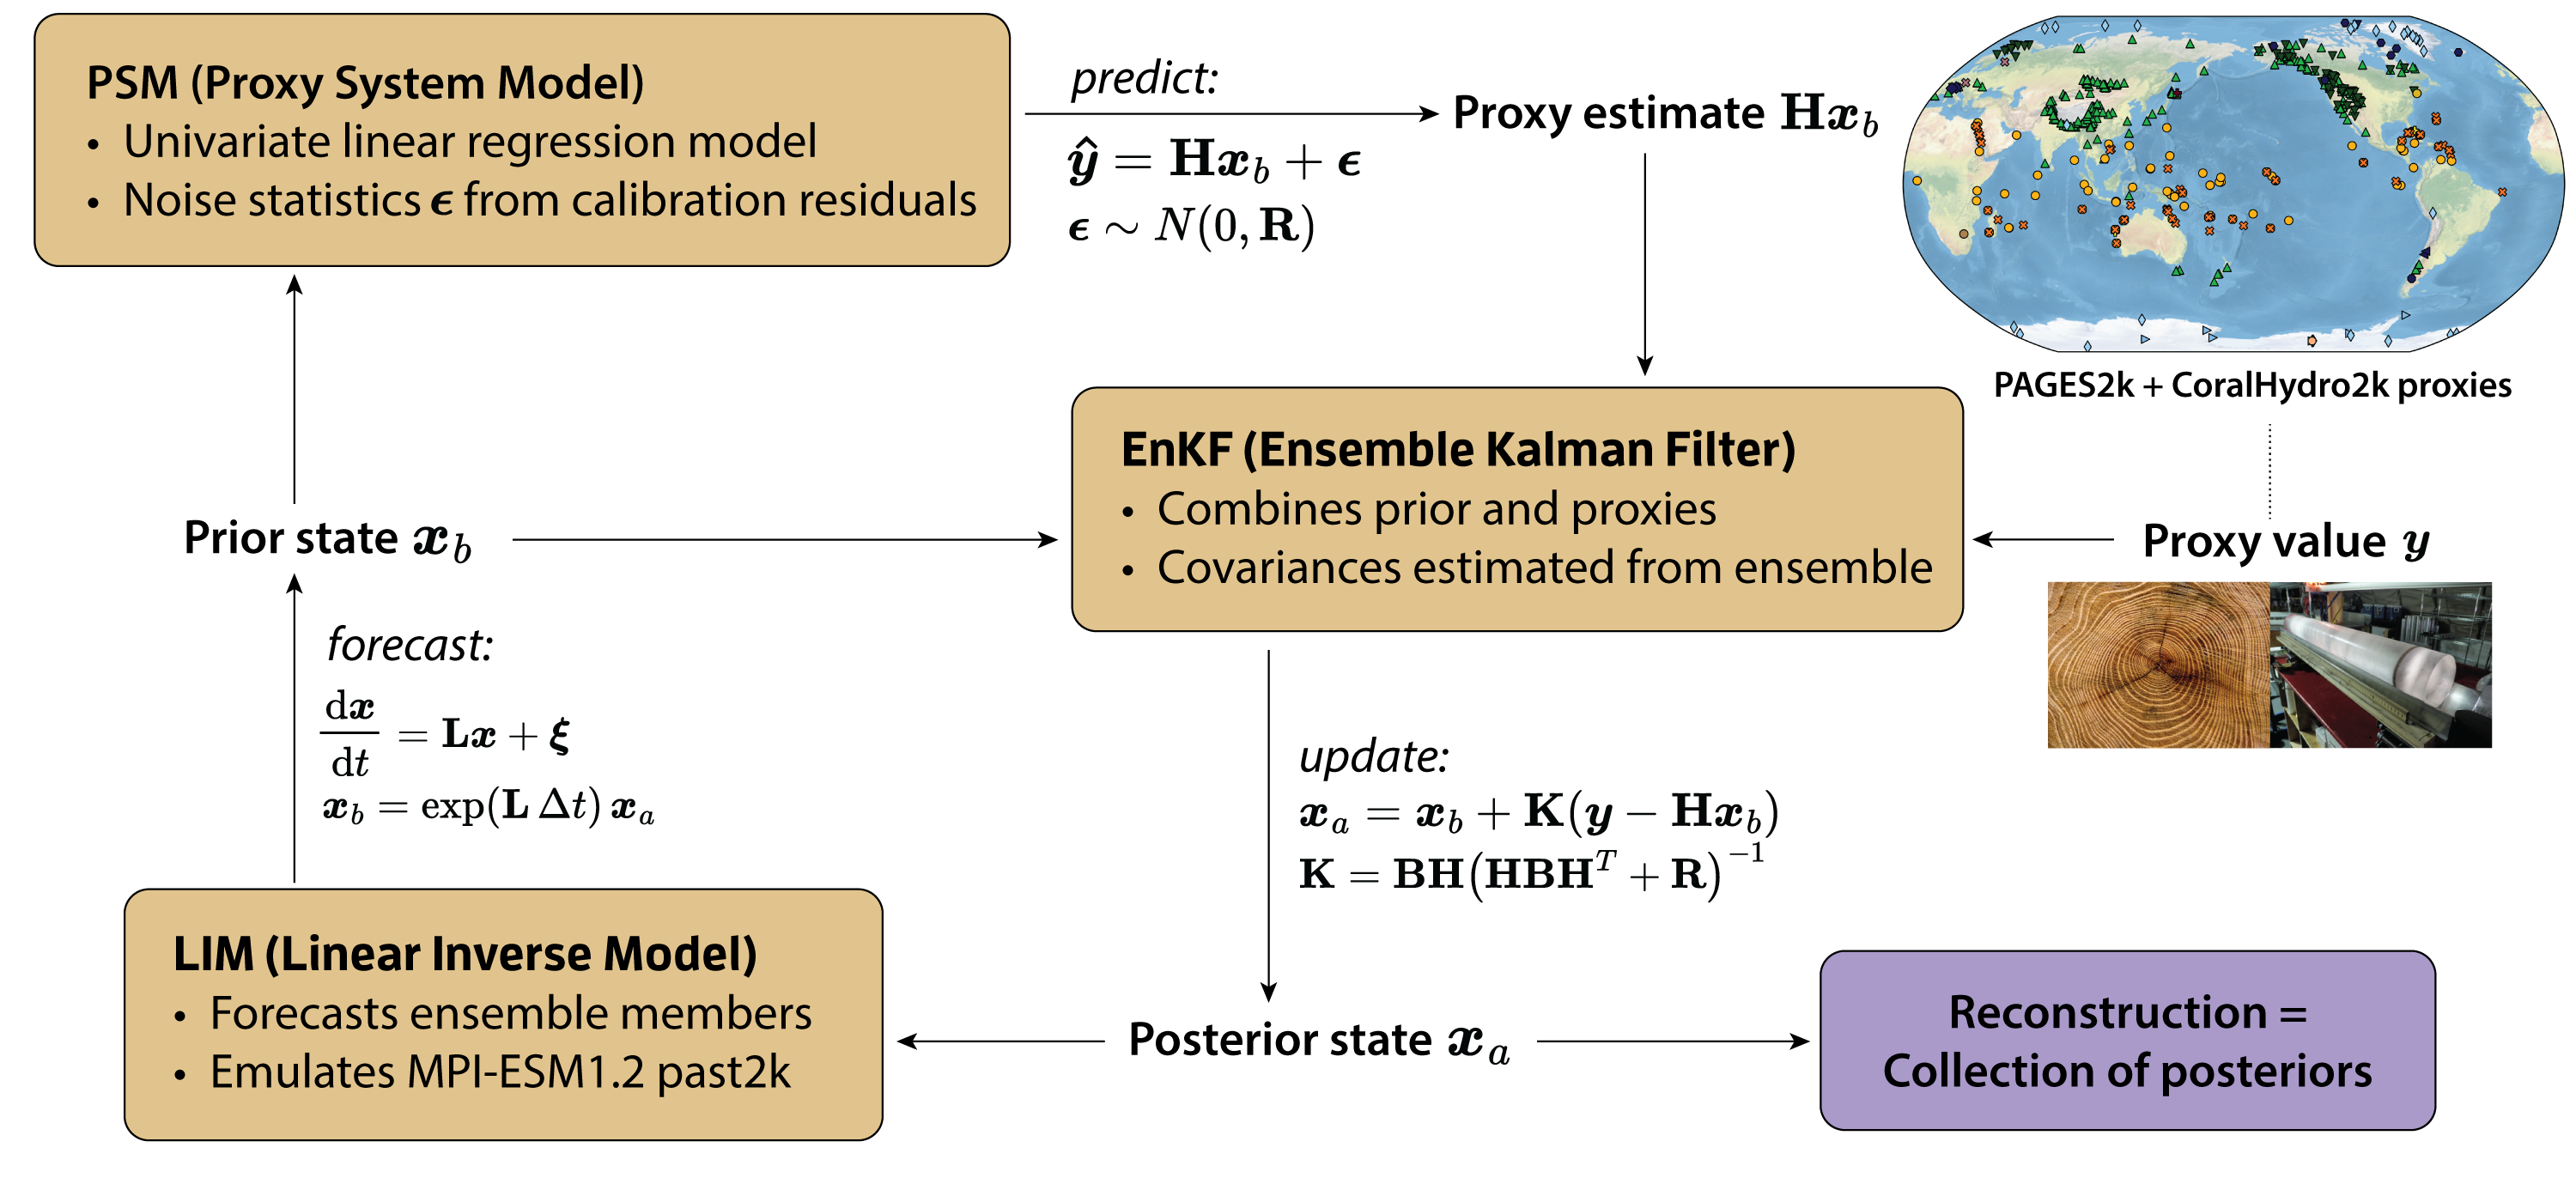
We present preliminary results of reconstructed TOA radiation fields over the last millennium (1000–2000 CE) at seasonal resolution on a 2° × 2° grid, building on previous work in paleoclimate reconstruction of atmosphere and ocean variables (Perkins & Hakim, 2021). The reconstruction uses online data assimilation of temperature-sensitive proxies from the PAGES2k and CoralHydro2k proxy networks.
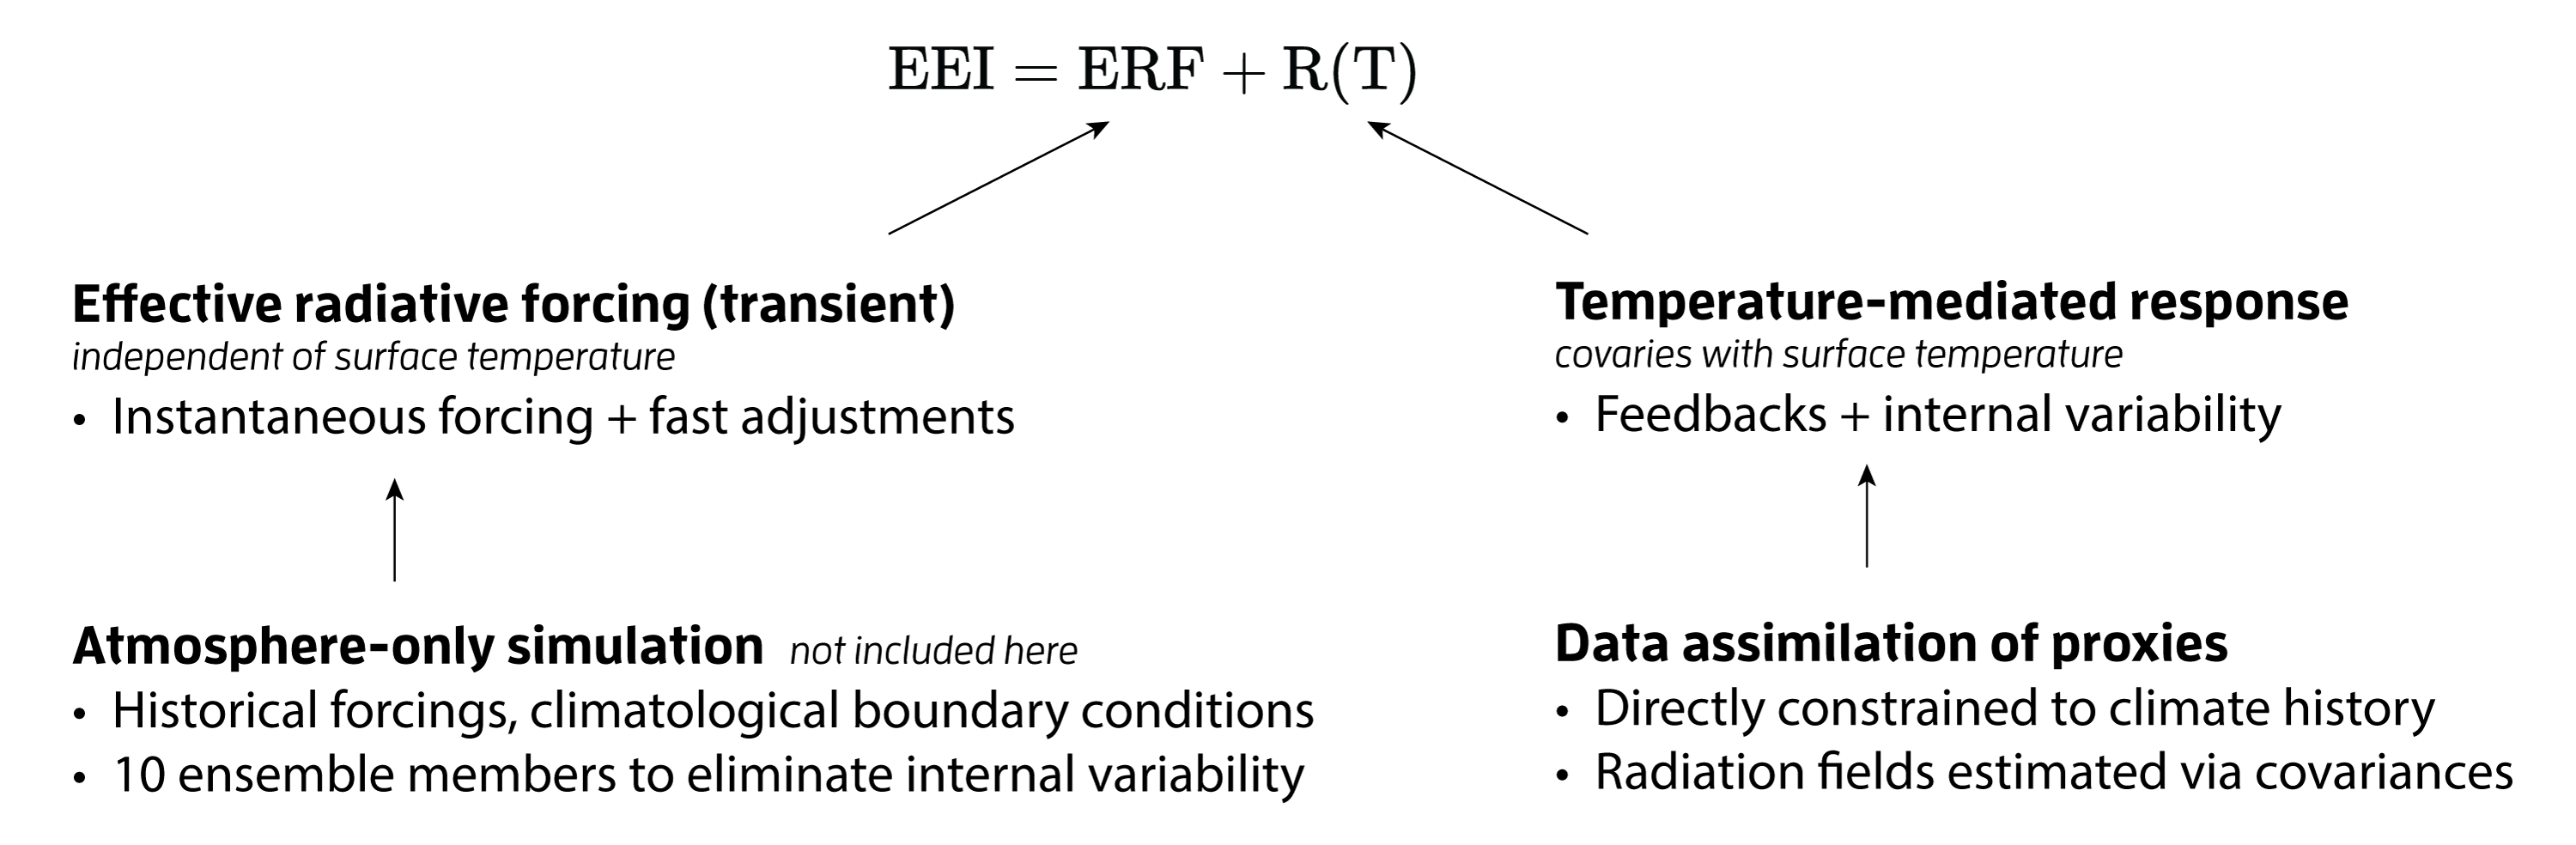
Note that all results related to radiation only contain the response, which covaries with surface temperatures (see Figure 1). Forced changes in radiation (ERF) will be reconstructed separately.
Key findings
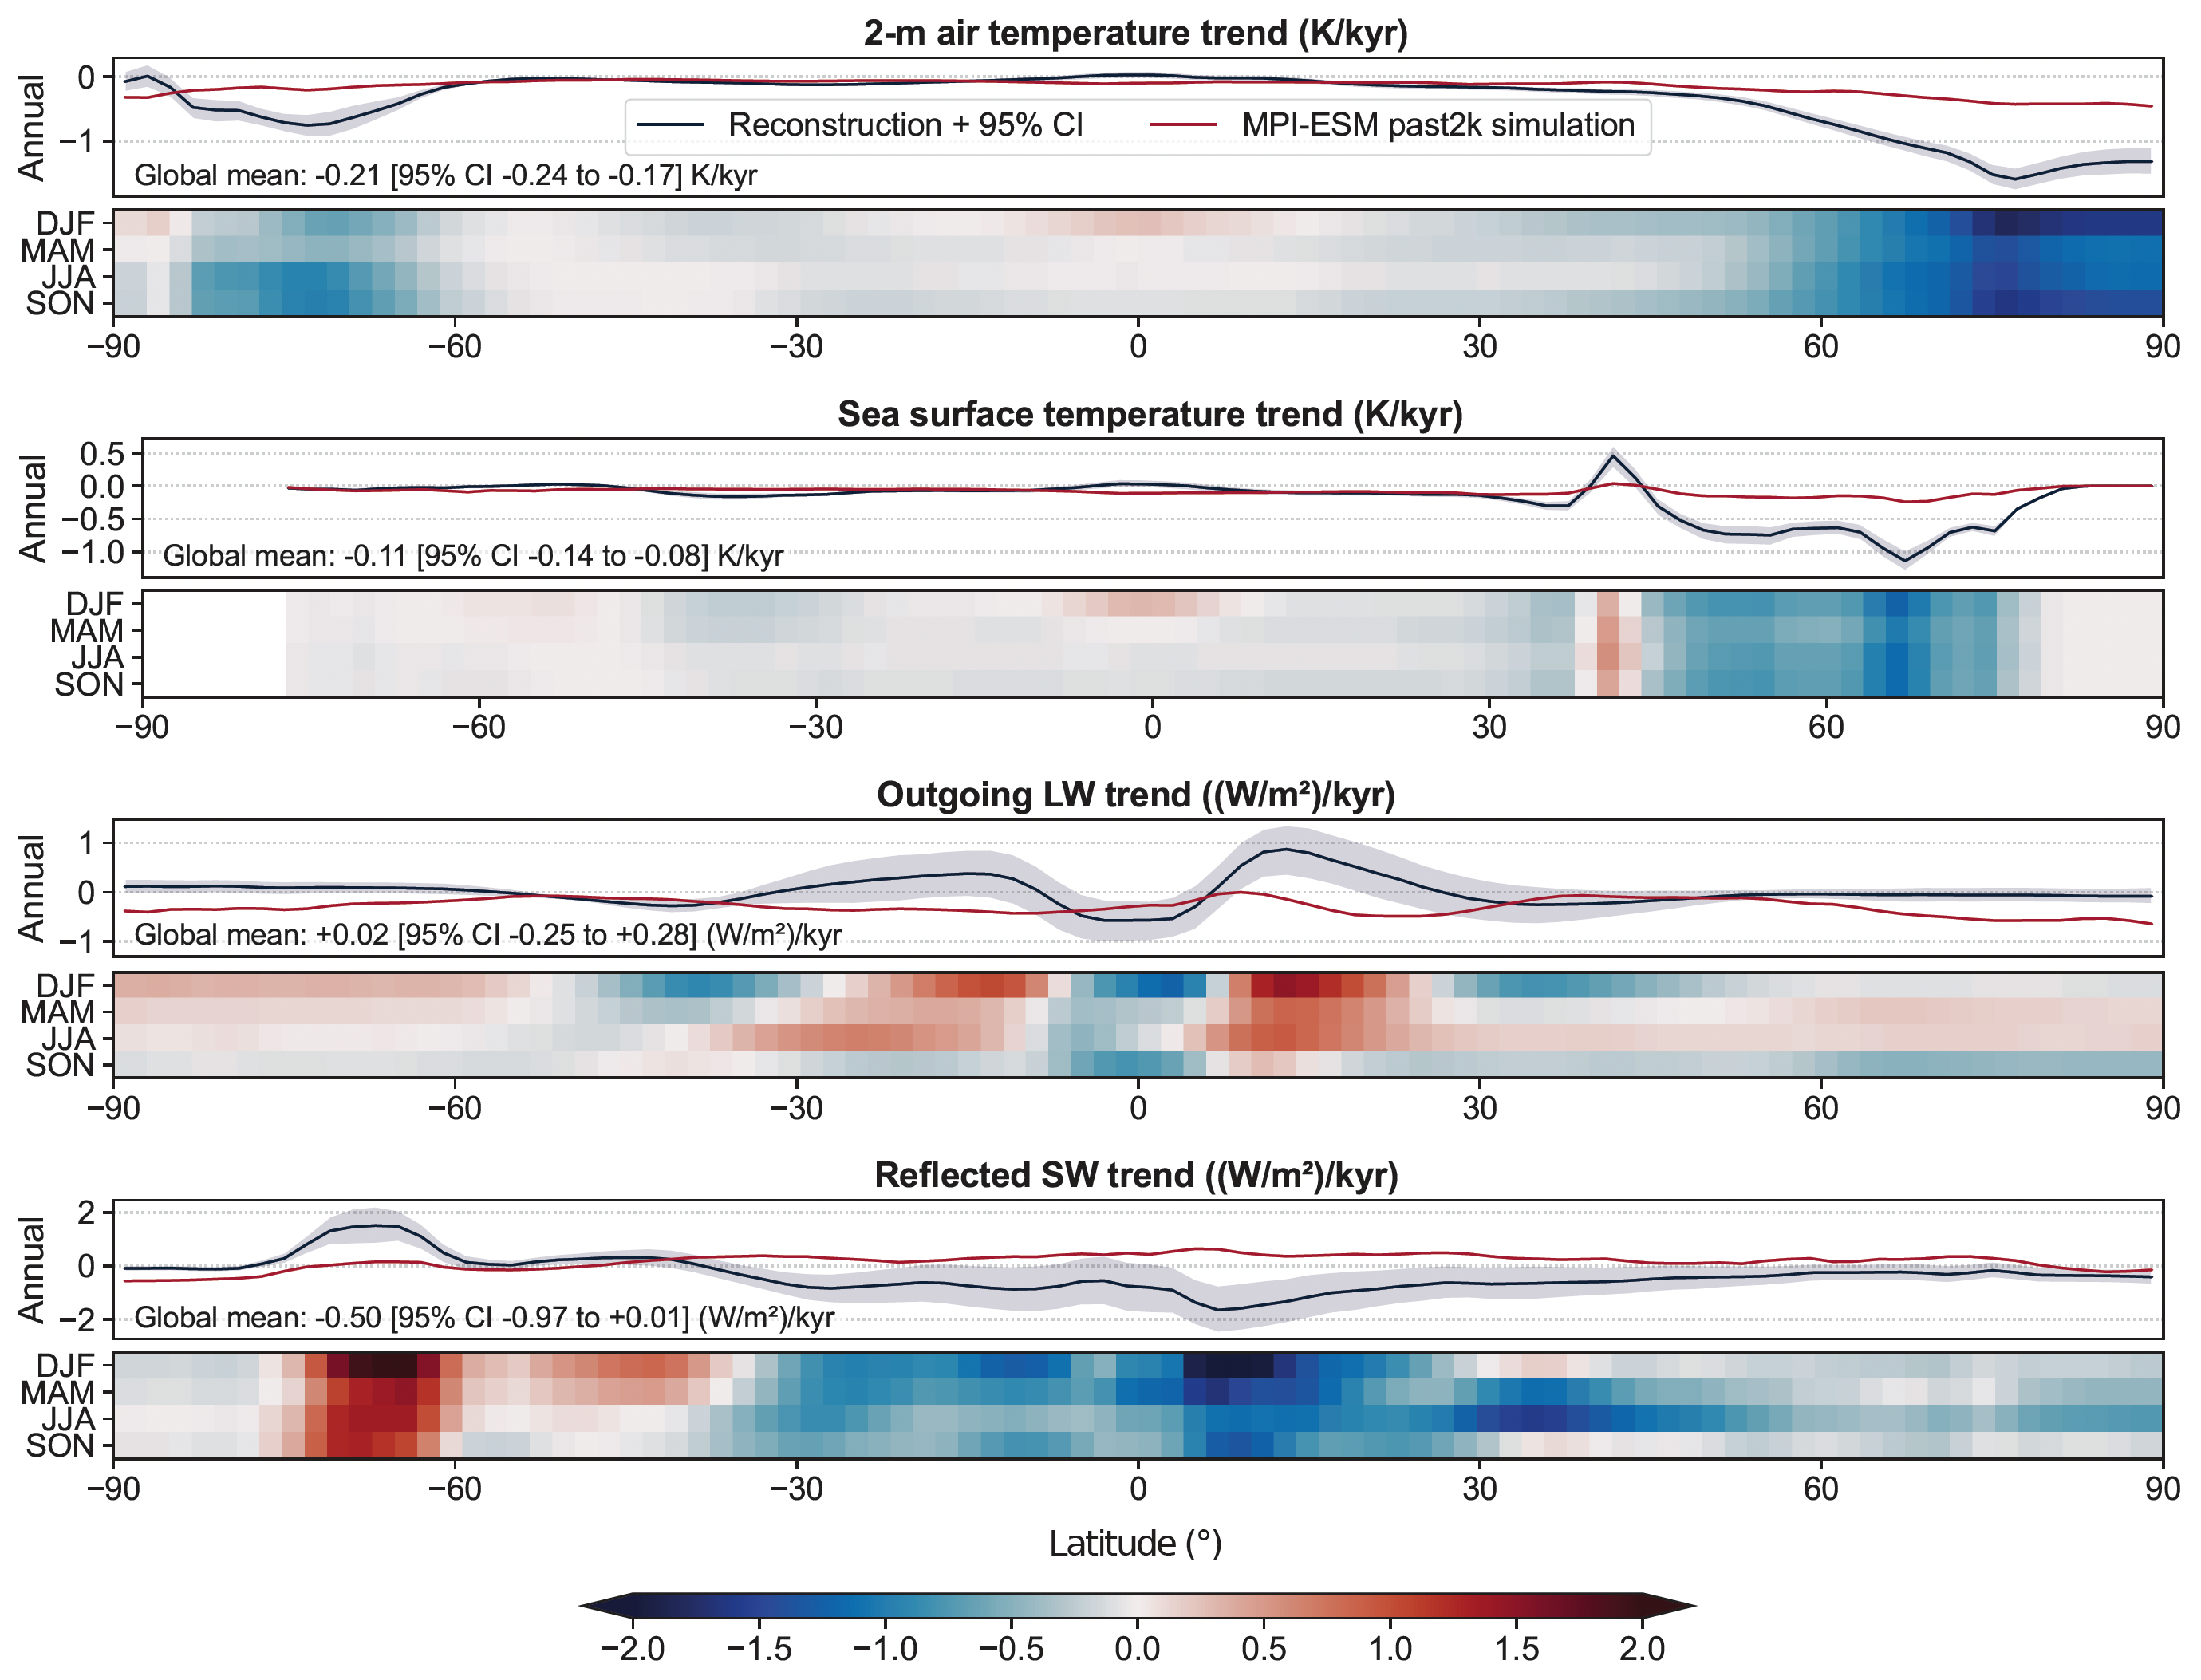
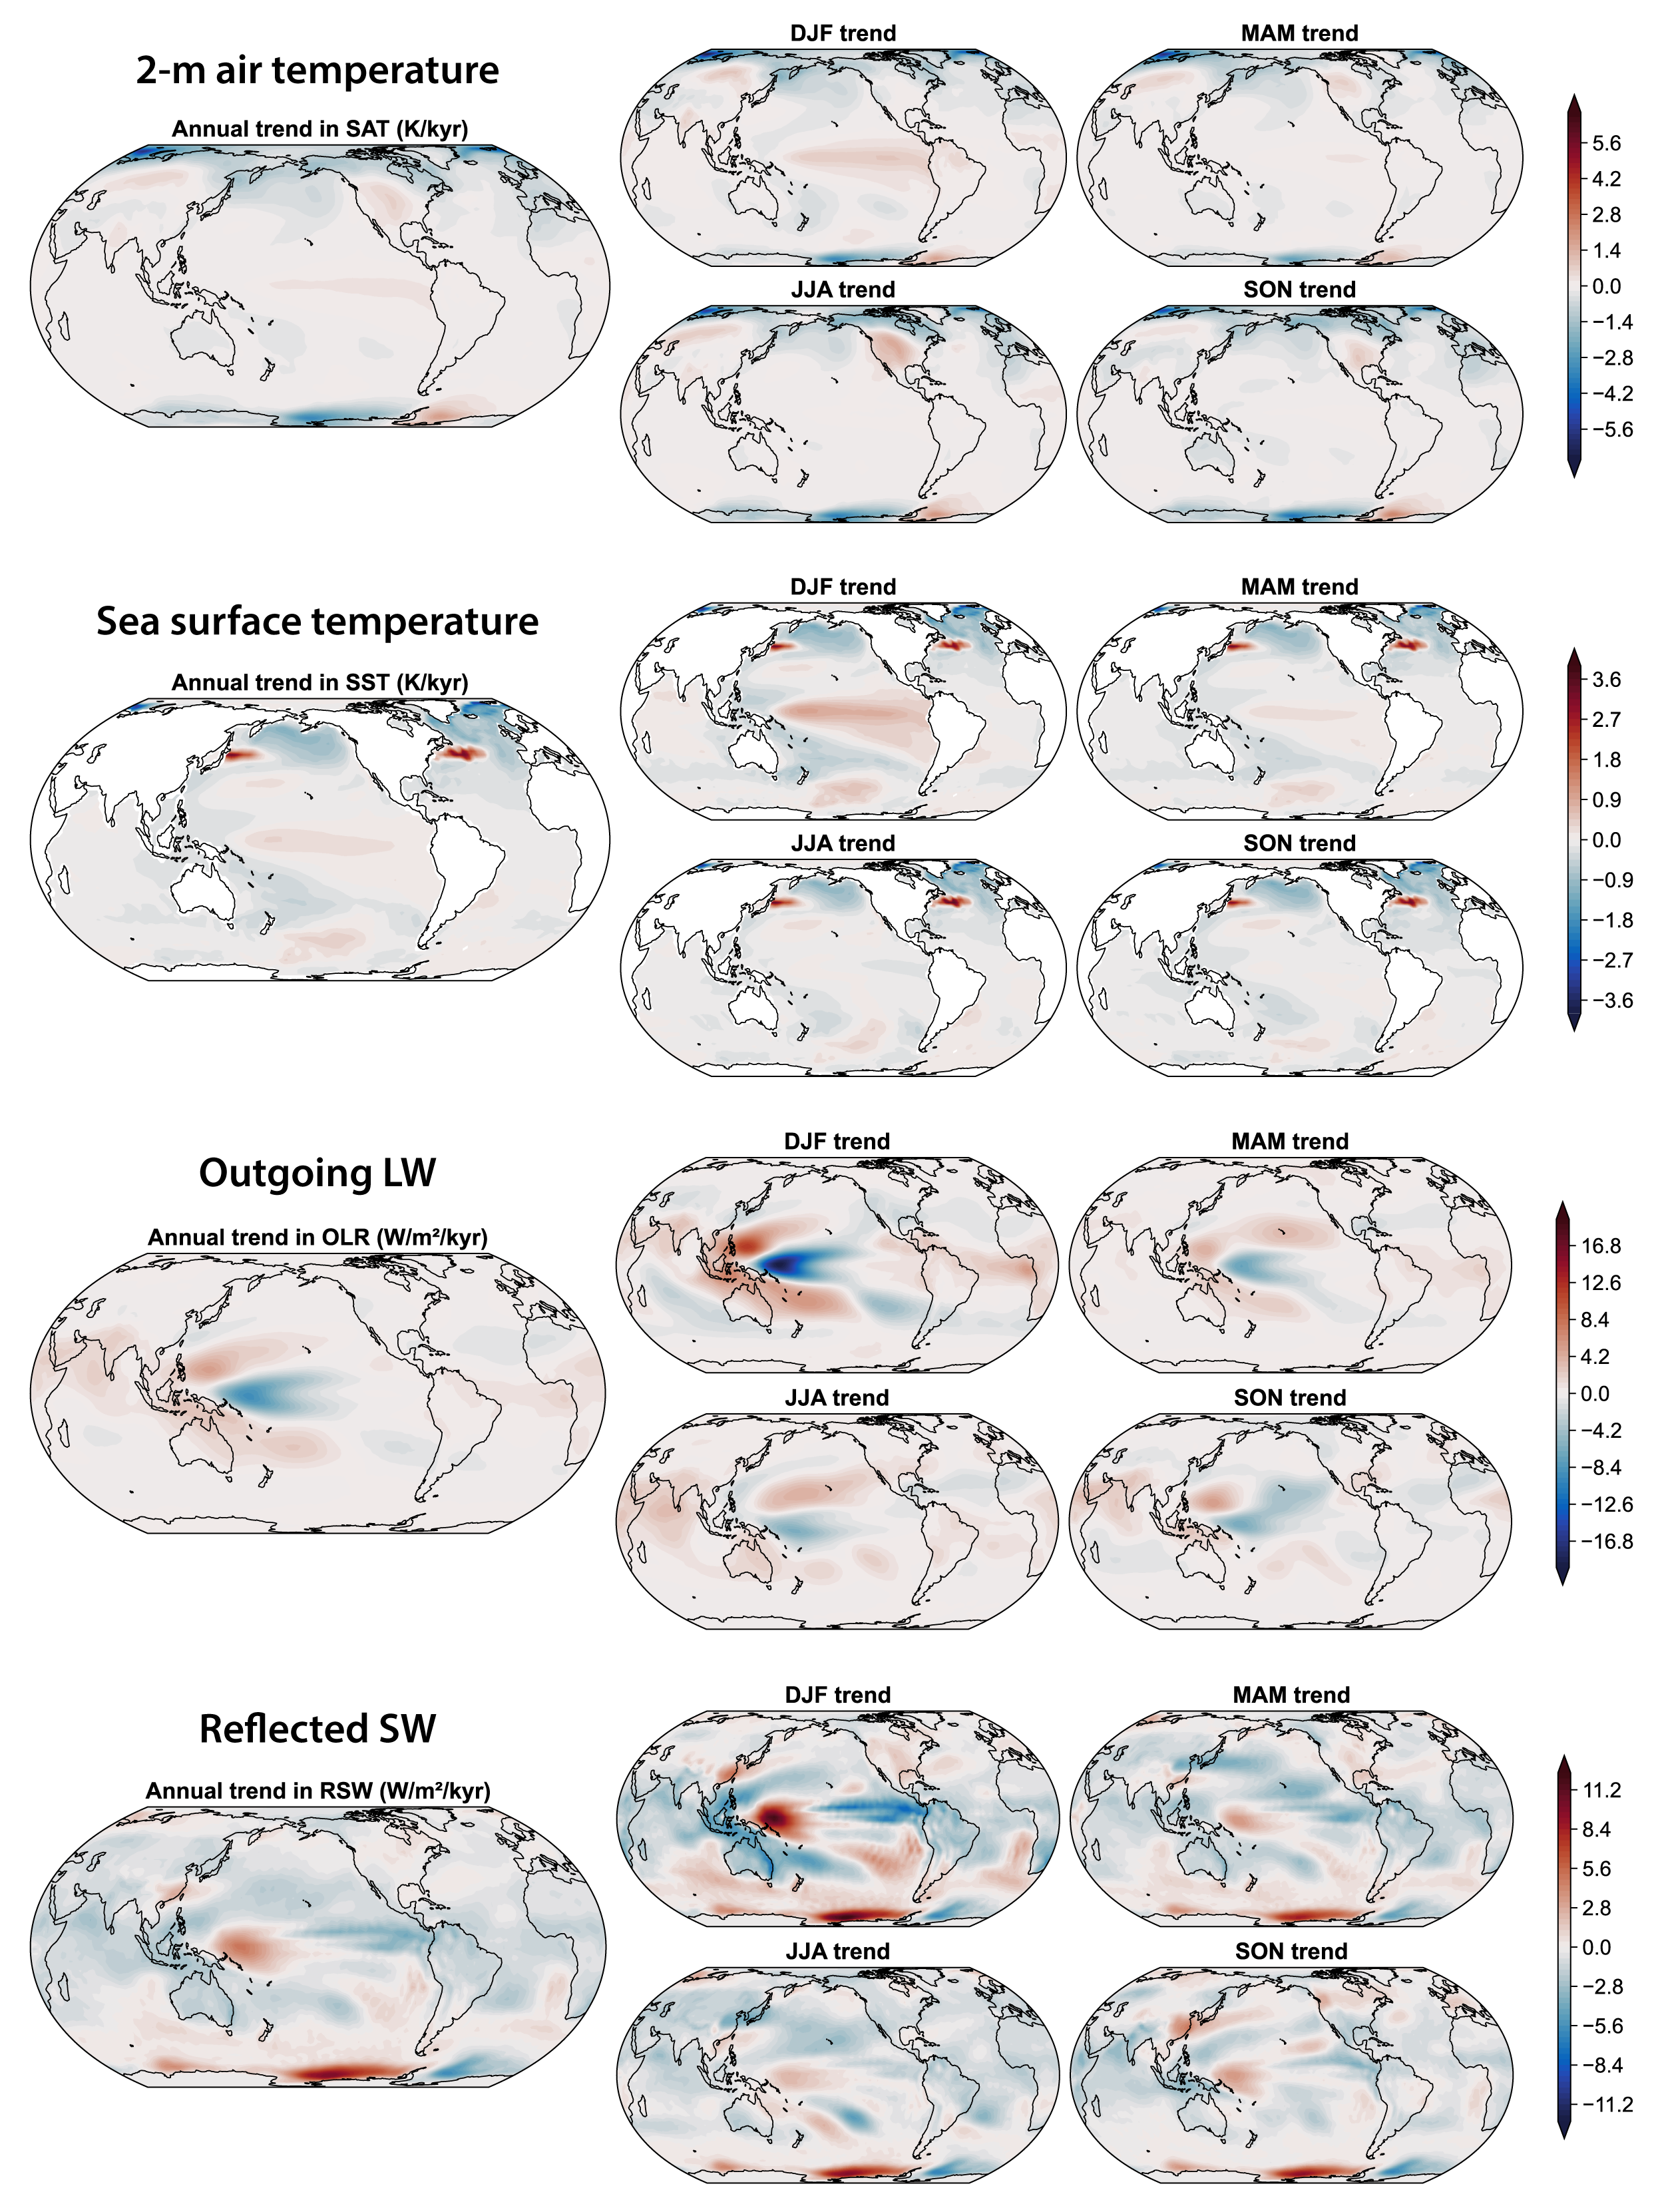
Earth responded to the forced cooling over the last millennium with reduced albedo in the tropics and subtropics, albeit offset by sea ice growth off the coast of West Antarctica, while global-mean OLR remained constant. The net outgoing response trend is -0.5 (W/m²)/kyr, corresponding to a feedback parameter of -2.3 (W/m²)/K; the climate system attempts to gain energy to restore radiative equilibrium (Figure 6).
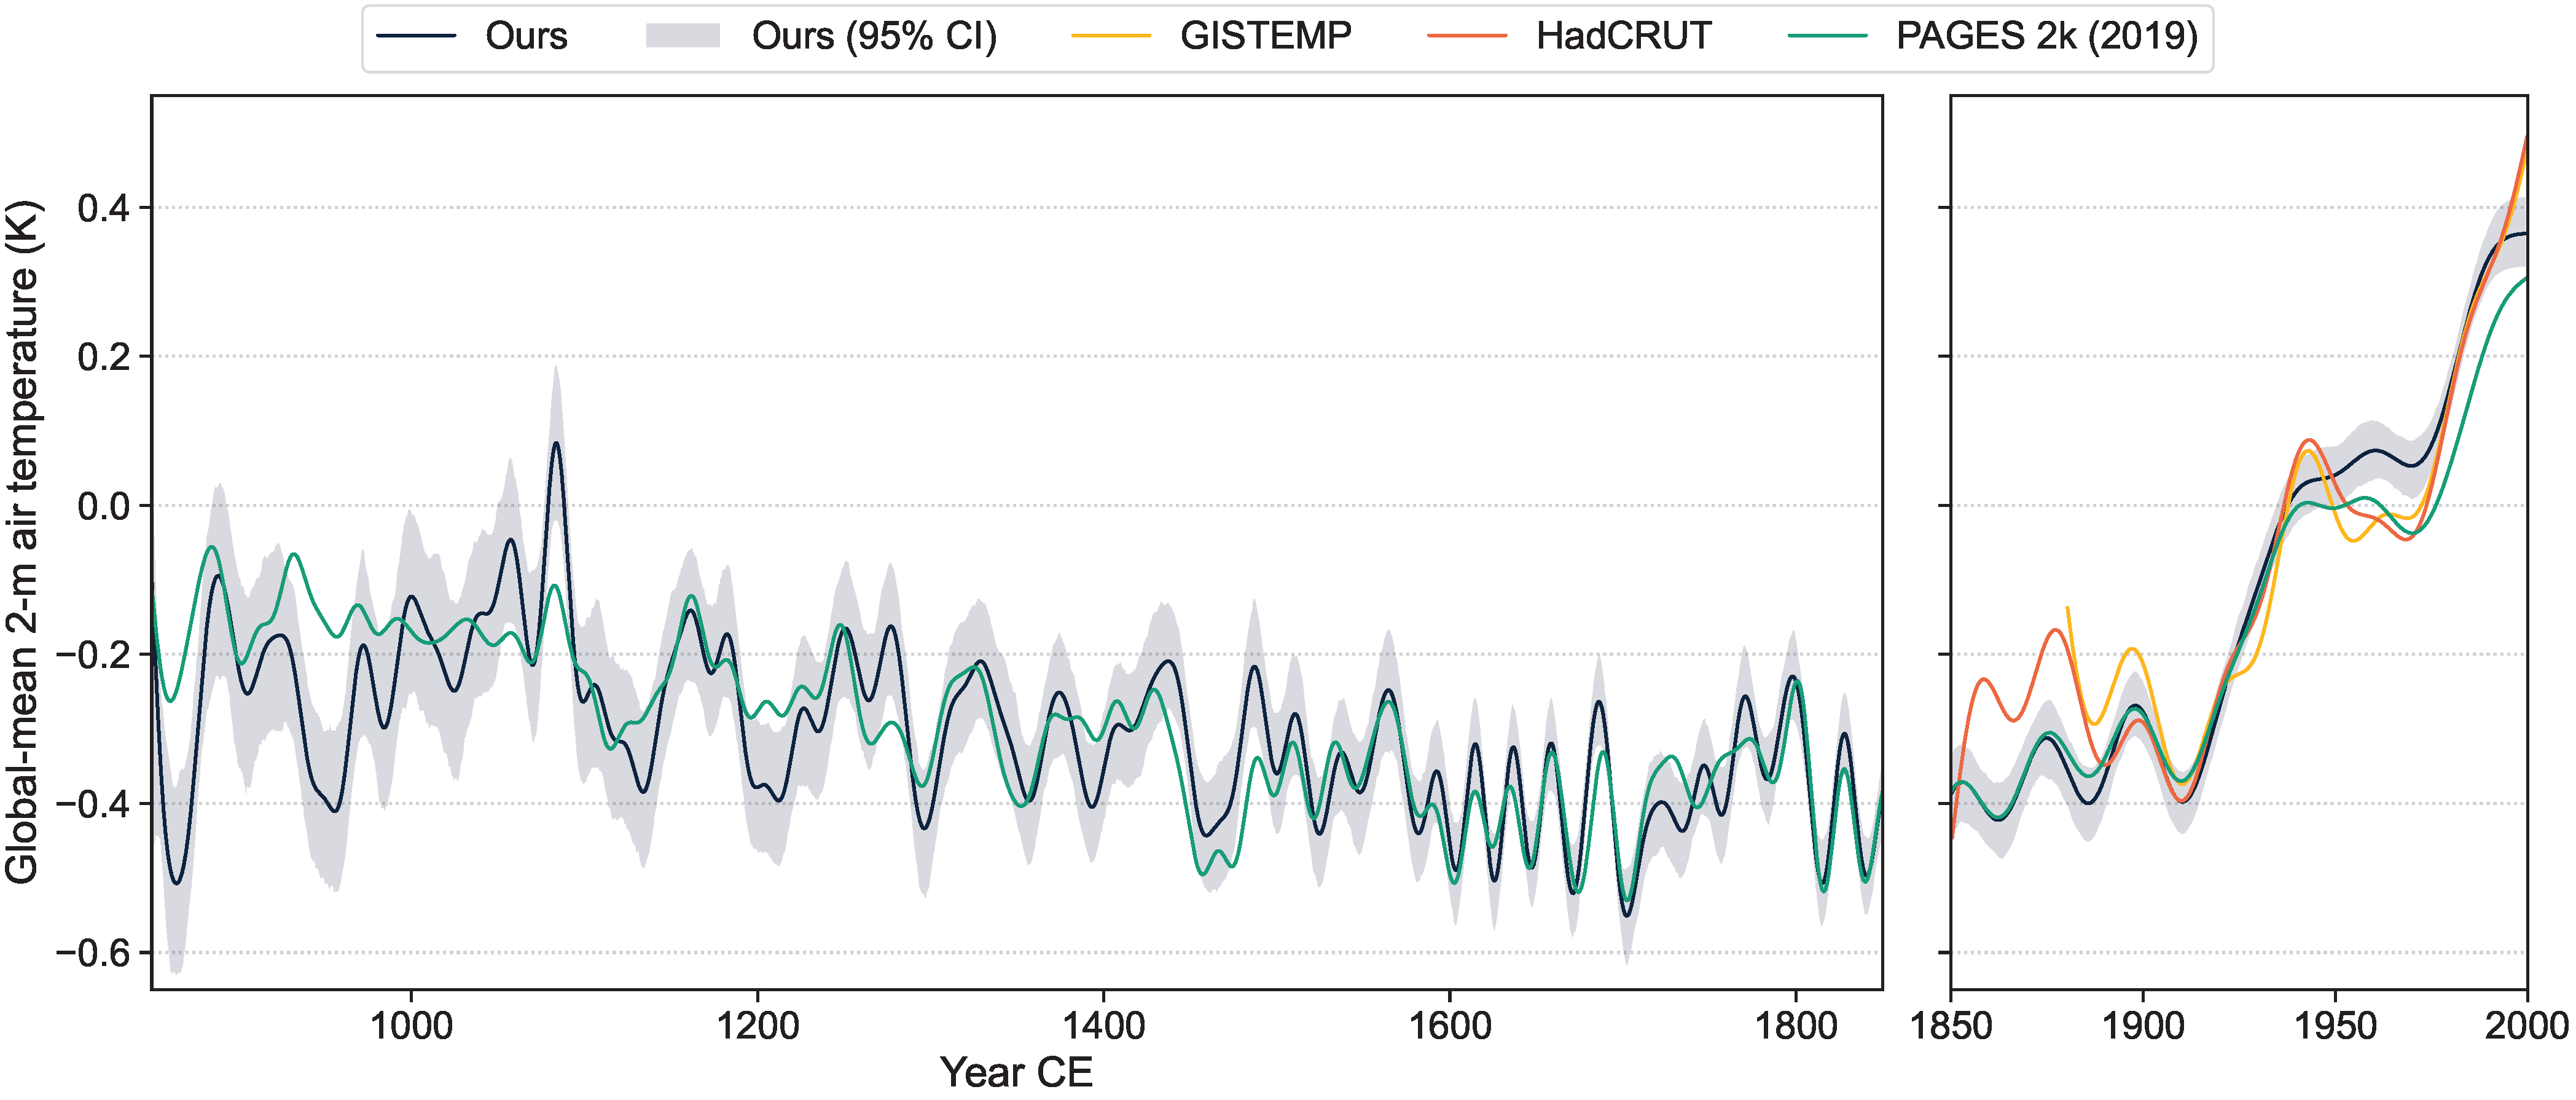
The temperature reconstruction has strong variability in the 50–150 year band. The millennial-scale cooling trend is -0.21 K/kyr (Northern Hemisphere: -0.29 K/kyr, Southern Hemisphere: -0.12 K/kyr; Figure 3).
The tropics show no annual temperature trend but have increased seasonal variations, possibly due to orbital forcing; cooling mainly occurred at high latitudes and was accompanied by strong cooling of the North Pacific and North Atlantic (Figure 6).
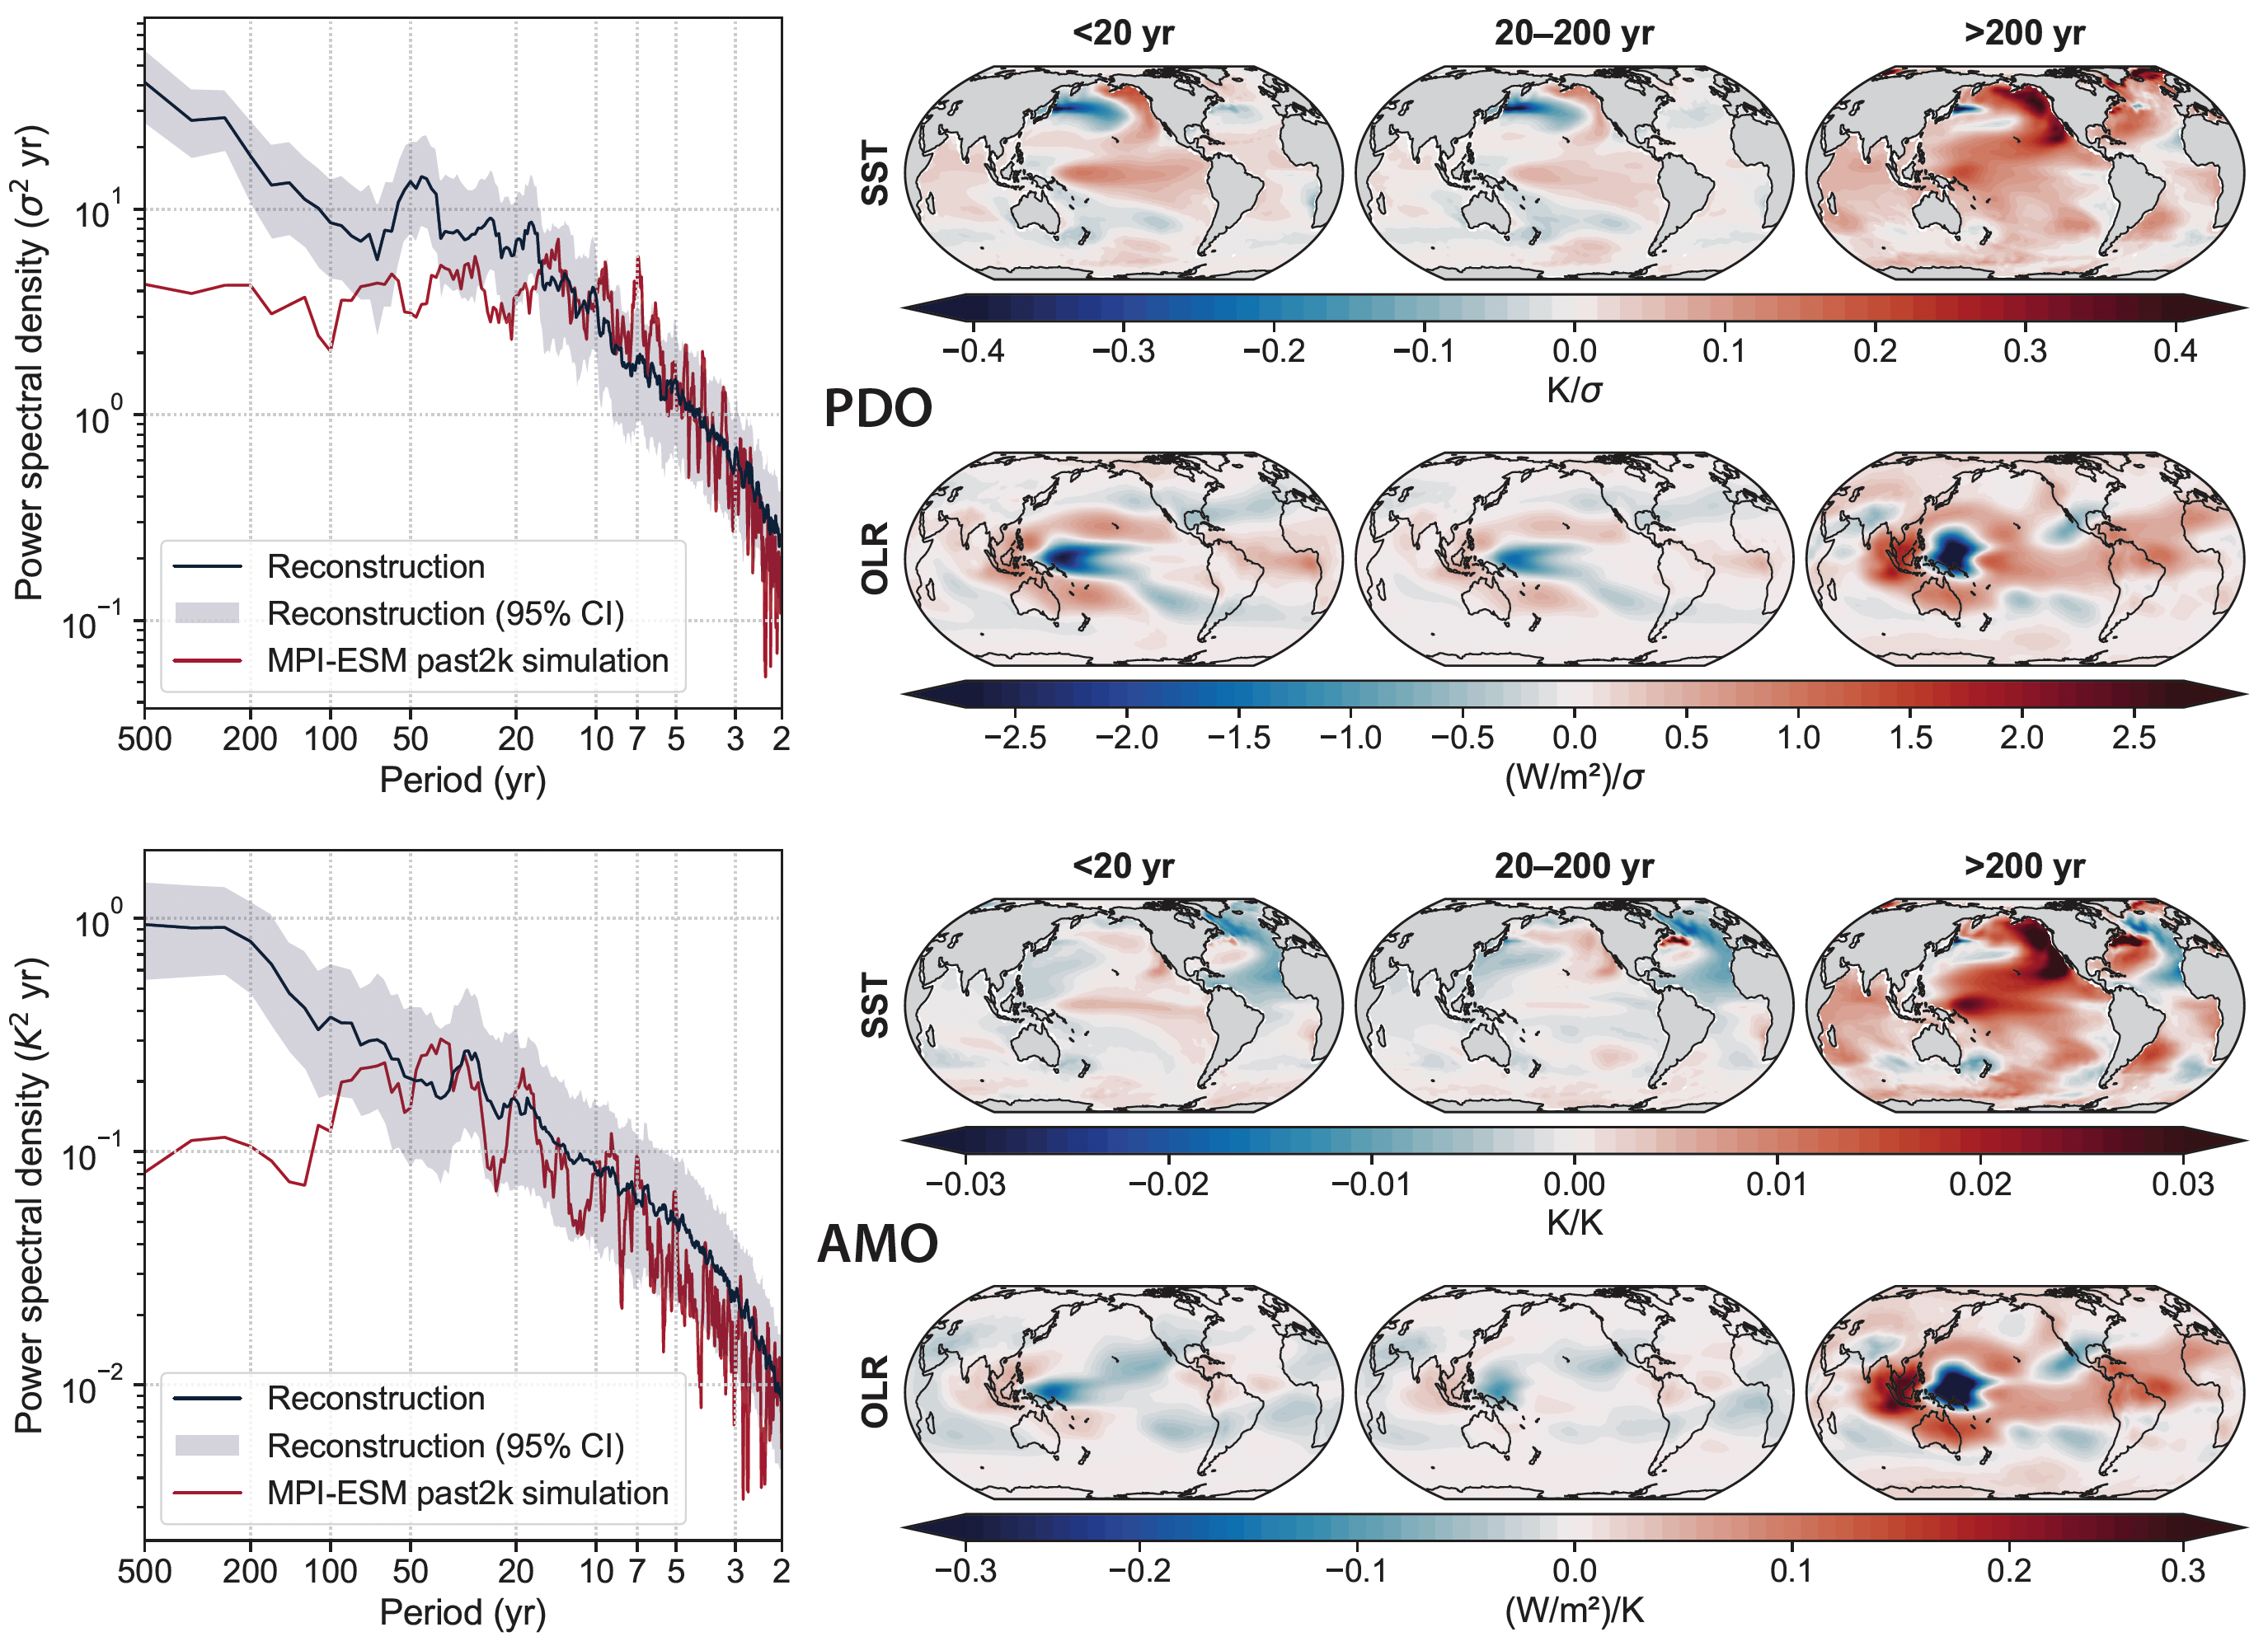
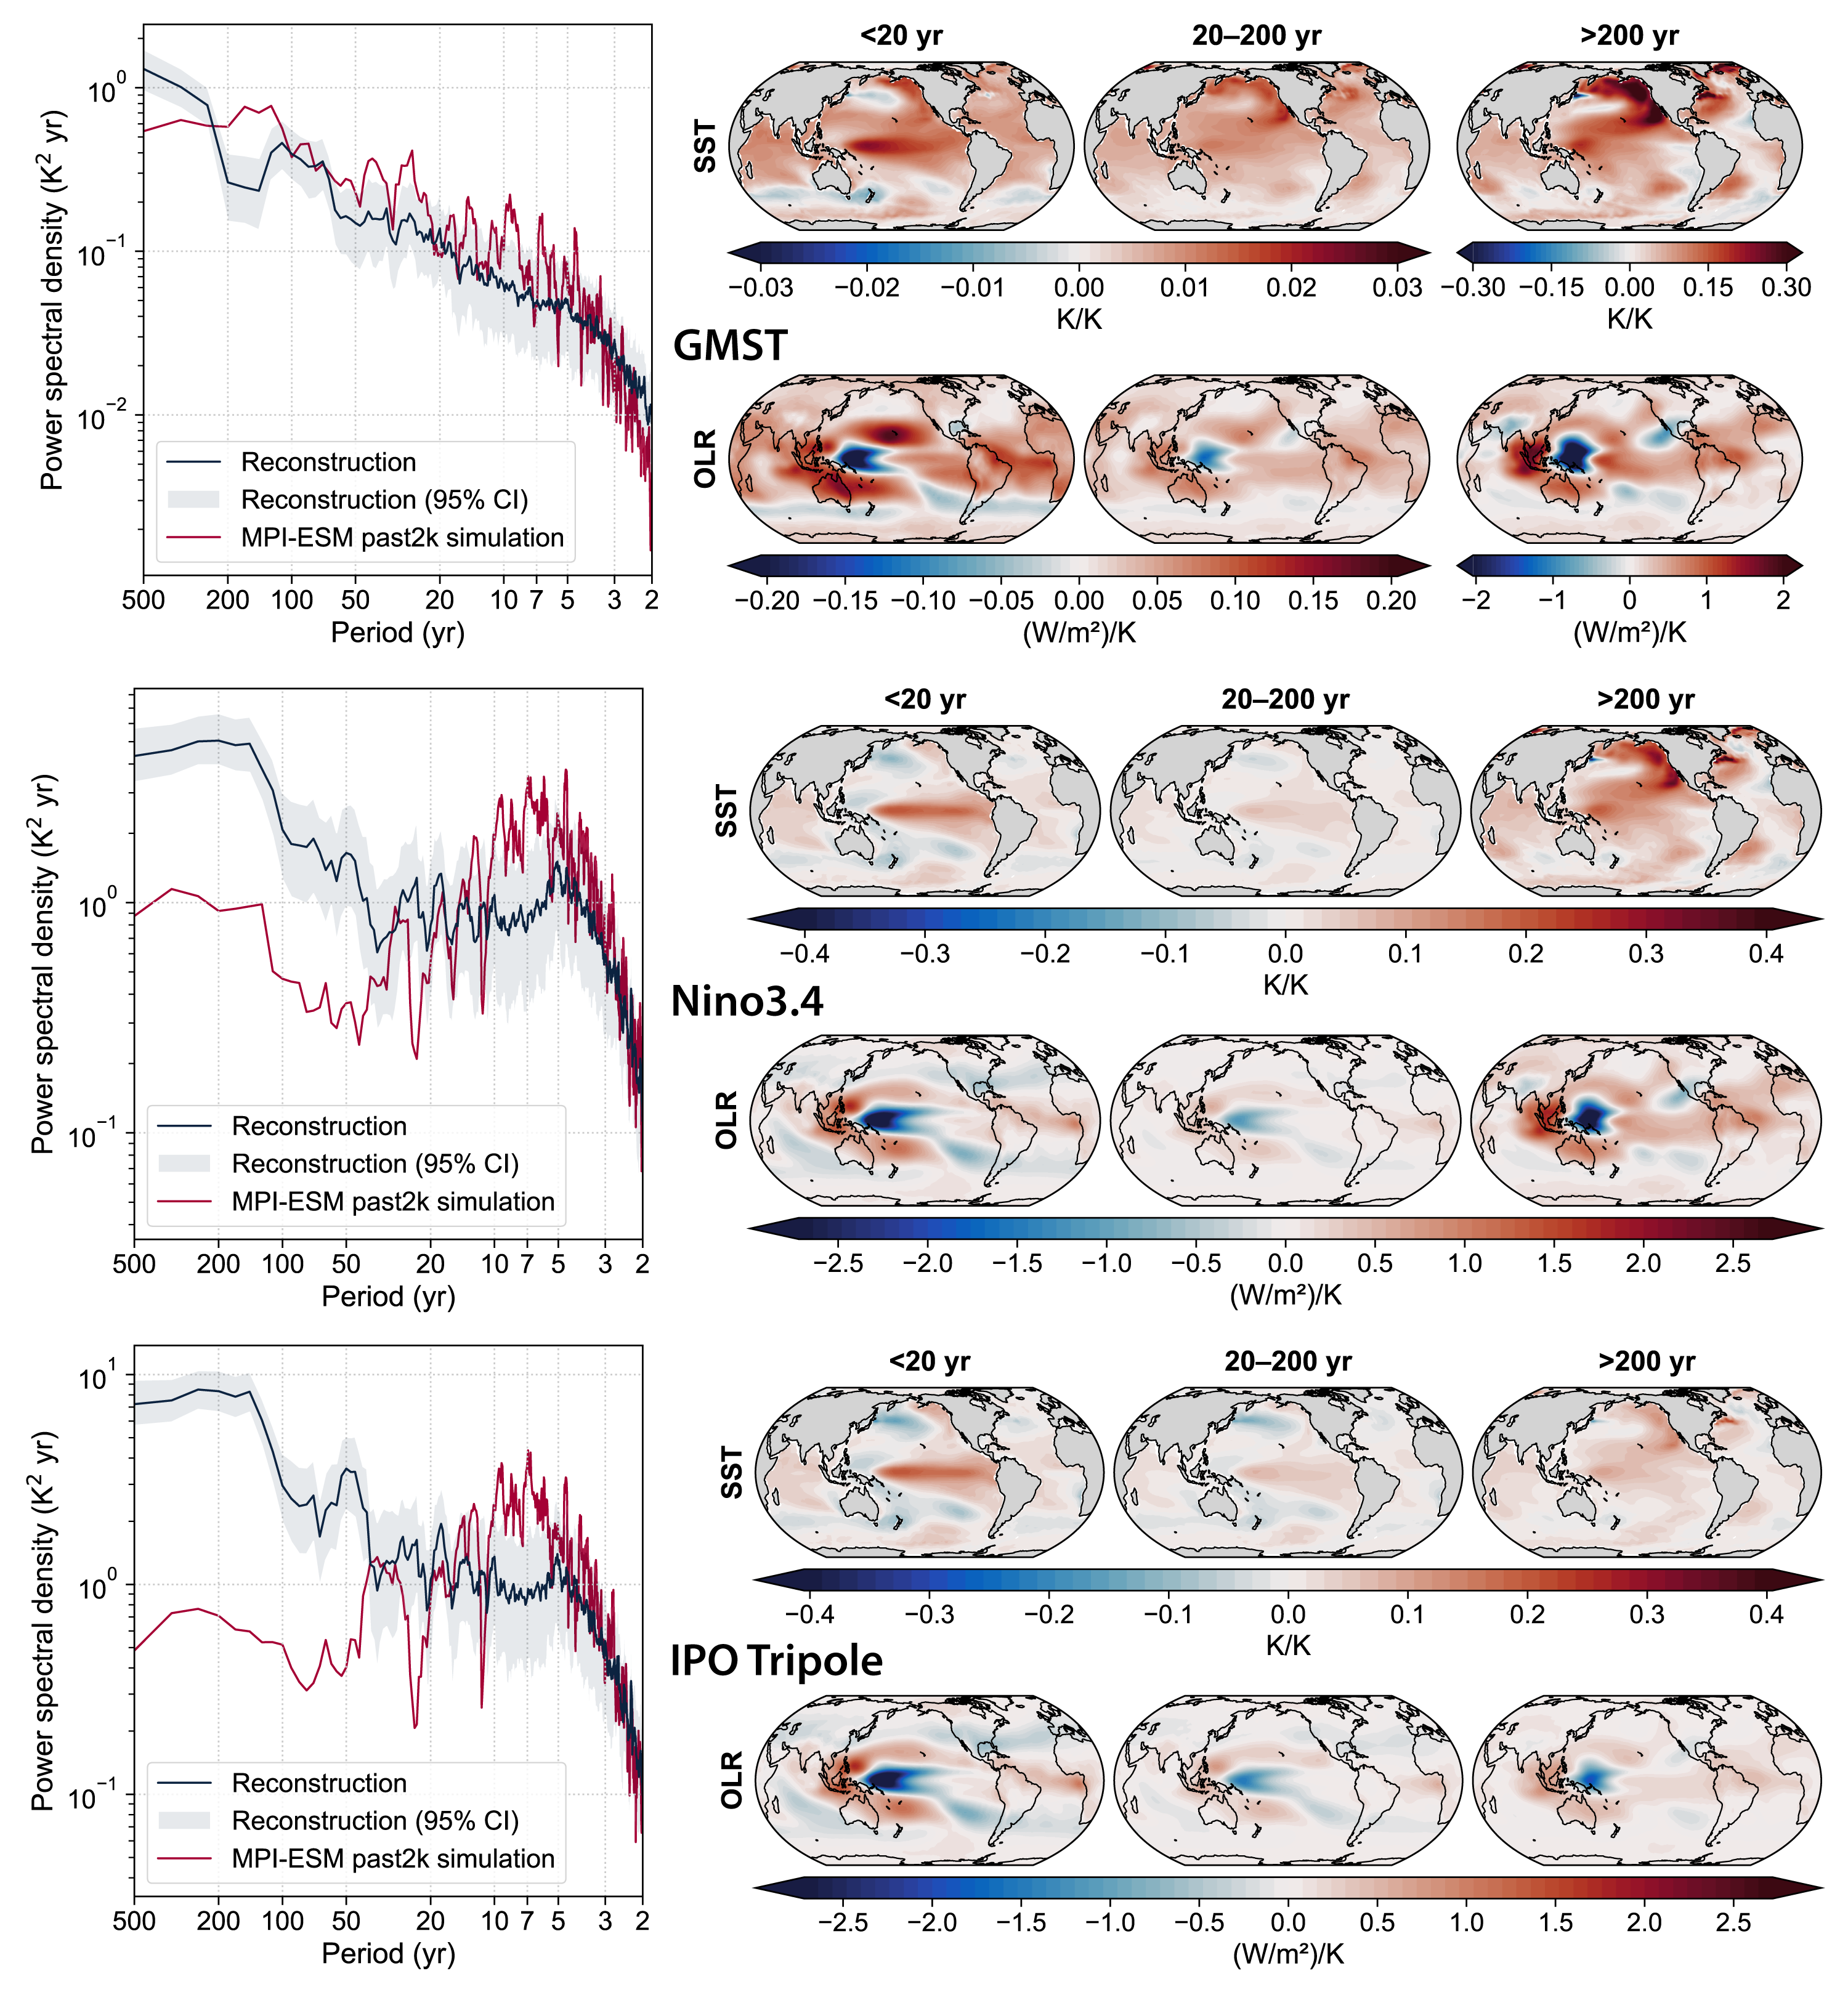
AMO and PDO have distinct OLR signatures, despite similar SST patterns in the tropical Pacific. PDO-like variability is strongly linked to OLR at decadal to centennial timescales while AMO-like variability has a weaker OLR signature at <20 yr than in the 20–200-yr band (Figure 5).
Figures
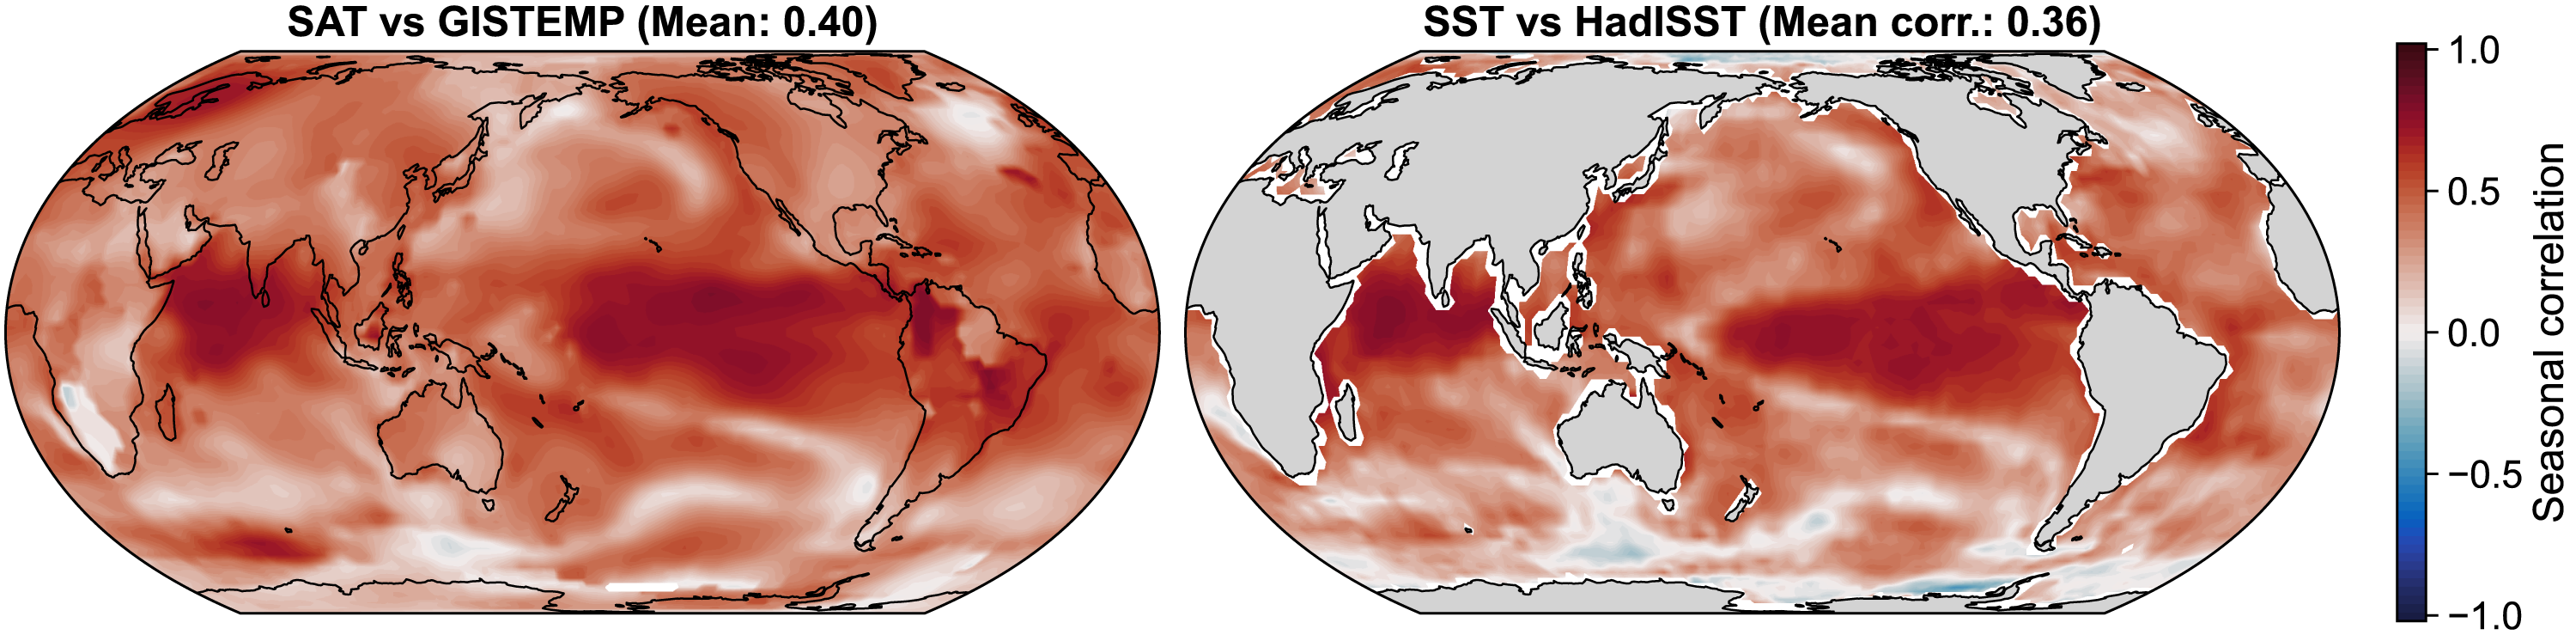
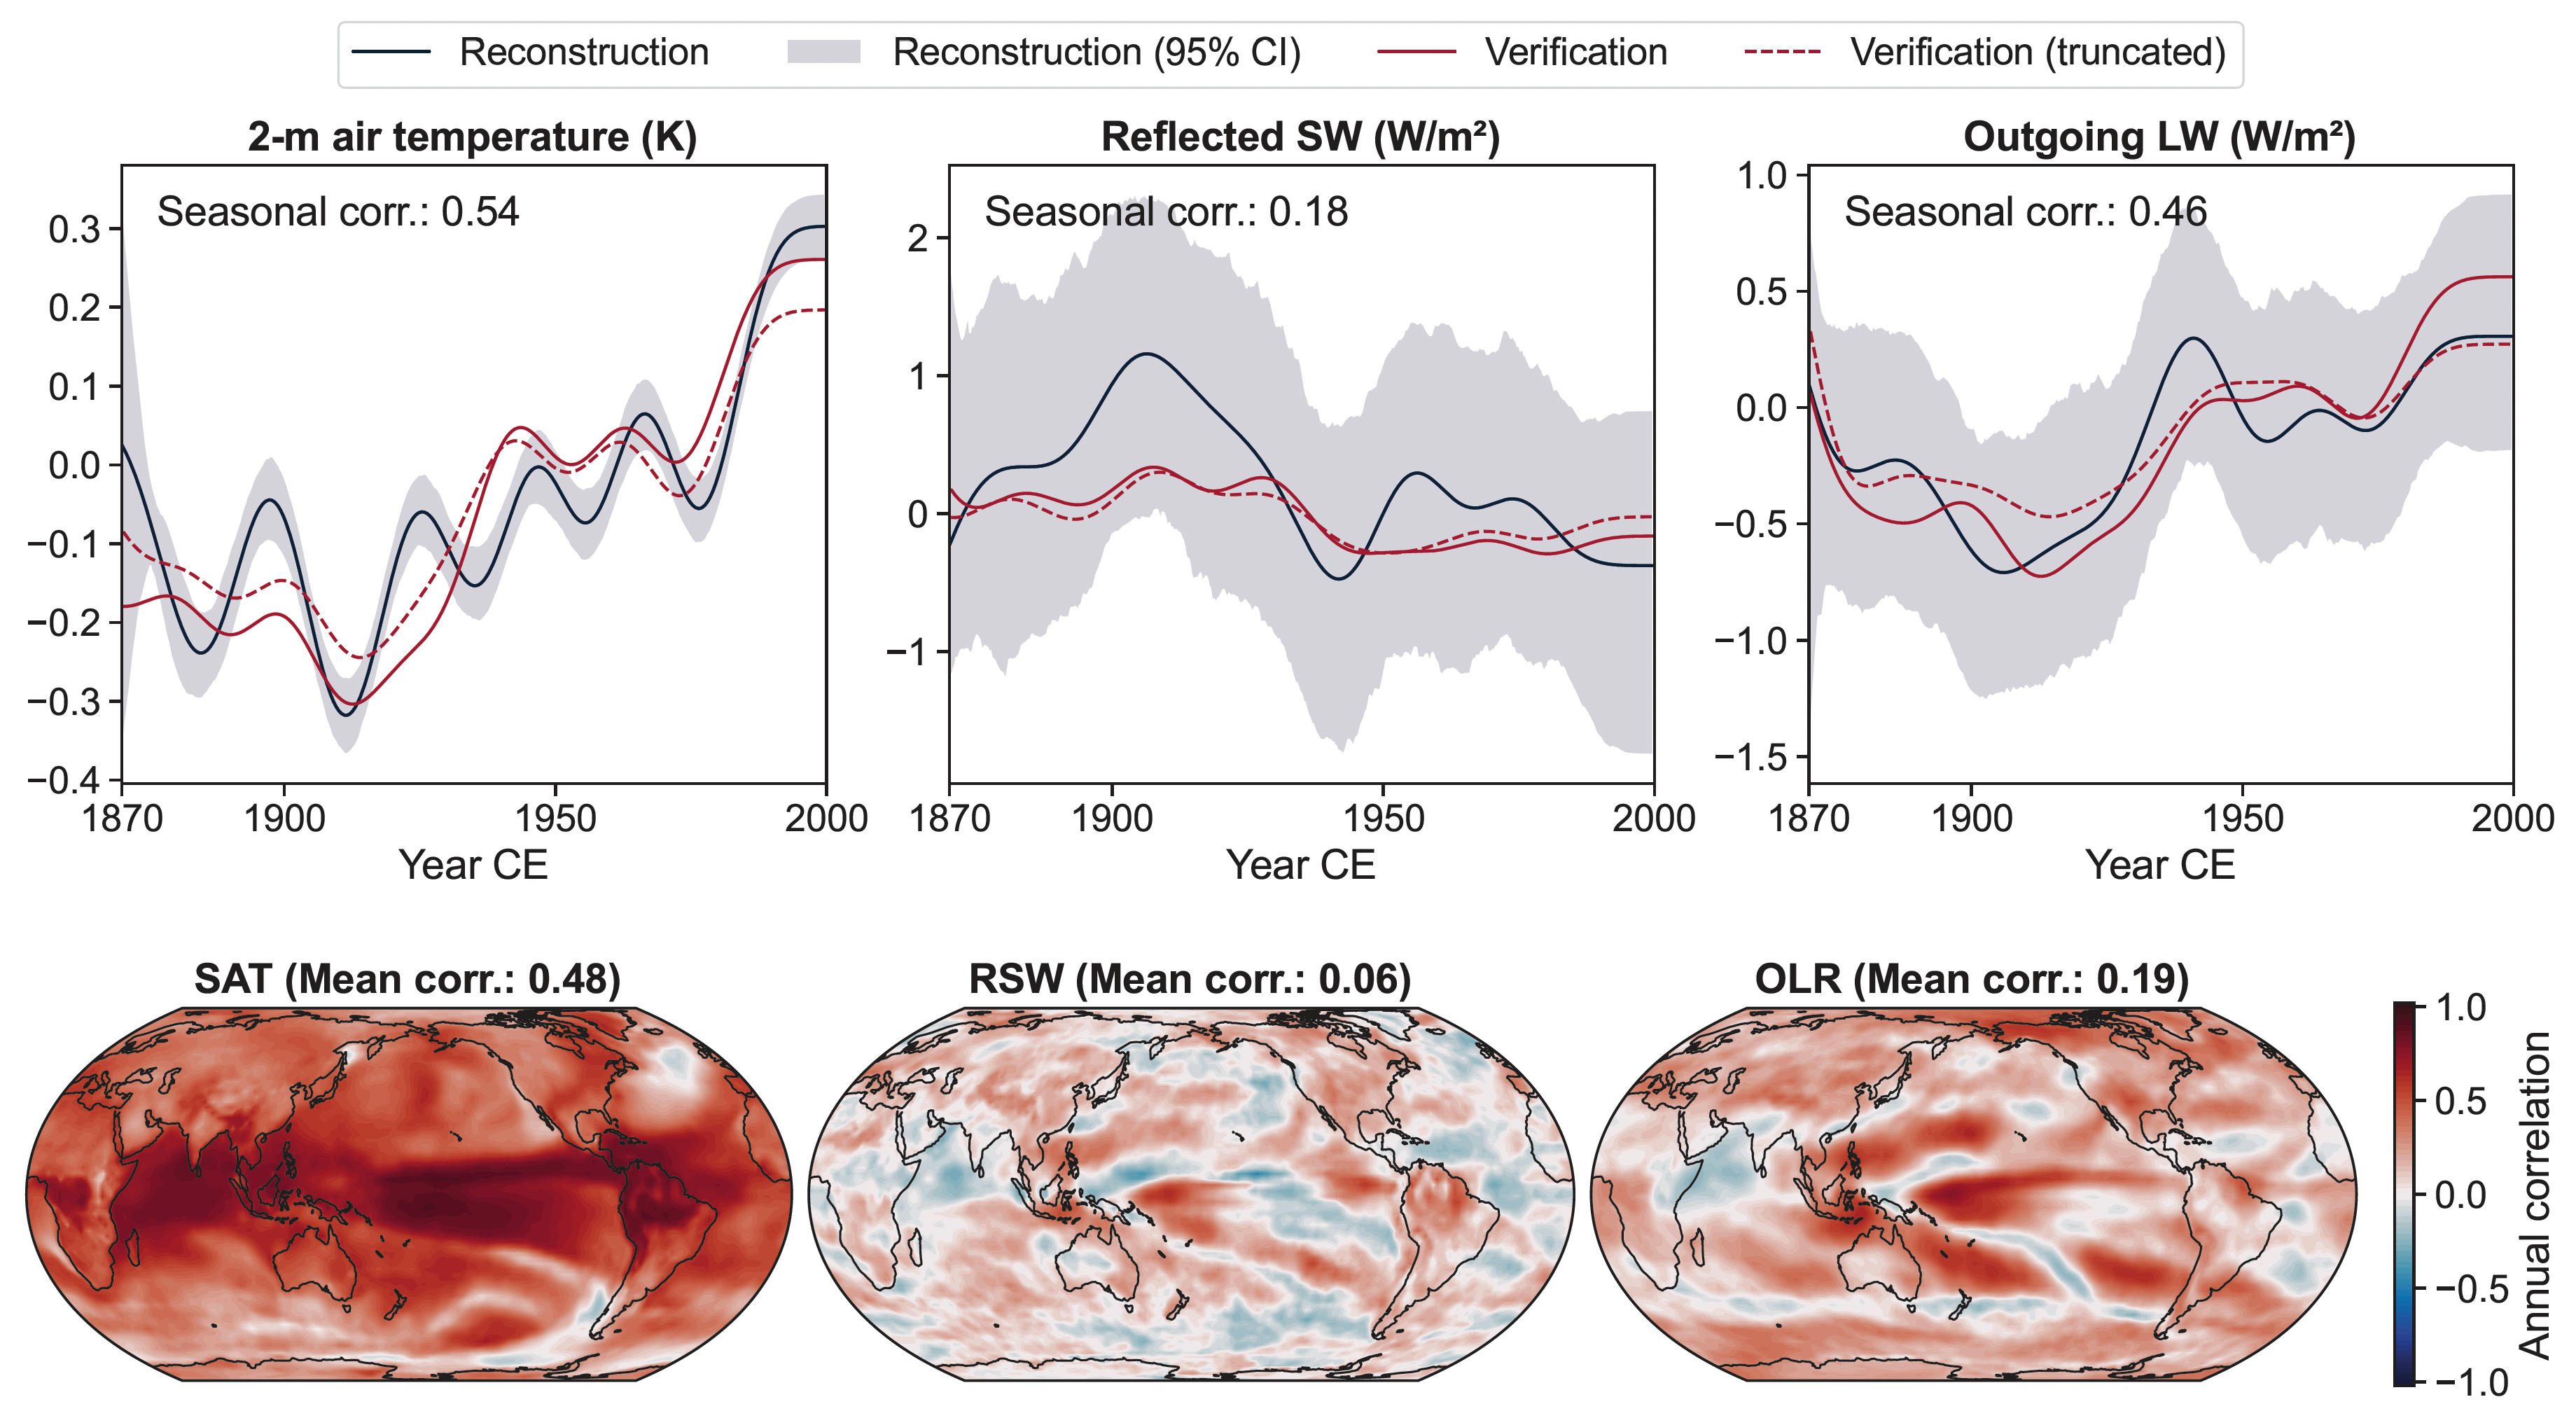
Figure 1The EEI and its constituent shortwave (SW) and longwave (LW) fields can be decomposed into two components, which we reconstruct separately. For this poster, we only consider the temperature-mediated radiative response. The transient effective radiative forcing (ERF; Forster et al., 2016) will be reconstructed using CESM2/CAM6.Figure 2We use online data assimilation with an ensemble Kalman filter and a linear inverse model (emulates the MPI-ESM1.2 CMIP6 past2k simulation) to combine information from proxies and a model forecast. 630 temperature-sensitive proxies are taken from the PAGES2k and CoralHydro2k databases. The state vector contains the leading 20 EOFs of 2-m air temperature (SAT), sea surface temperature (SST), reflected TOA SW radiation (RSW), outgoing TOA LW radiation (OLR), and the ocean heat content of the upper 700 m. Our ensemble has 400 members.Figure 3Global-mean 2-m air temperature anomalies relative to 1951–1980 (20-year lowpass-filtered). There is strong low-frequency variability with 50–150-year periods. Over 850–1850 CE, the surface cooled by -0.21 K/kyr in transition to the Little Ice Age (Northern Hemisphere: -0.29 K/kyr, Southern Hemisphere: -0.12 K/kyr). Modern global warming is reconstructed well.Figure 4Seasonal correlations between our reconstruction and the instrumental GISTEMP (left, for SAT over 1880–2000 CE) and HadISST (right, for SST over 1870–2000 CE) datasets. The reconstruction has global skill in the temperature fields, particularly in the tropics. This is a prerequisite to skillfully reconstruct the covariant radiation fields.Figure 5Power spectra of indices for the Pacific Decadal Oscillation (PDO) and the Atlantic Multidecadal Oscillation (AMO) over 850–1850 CE. Proxy reconstructions are known to overestimate low-frequency variability (e.g., Franke et al., 2013), but note that the MPI-ESM past2k simulation has no millenial-scale cooling trend. Right: Regression of SST and OLR onto the filtered indices from our reconstruction at different passbands. OLR patterns differs qualitatively between PDO and AMO. The multicentennial patterns (>200 yr) are likely due to global temperature trends since regressions onto the gloal-mean SAT are similar. Also see Figure S4 below for GMST, Nino3.4, and IPO.Figure 6Millennial-scale trends in zonal means over 850–1850 CE. The strong cooling is due to proxy information since the prior has no such trend. Seasonal variations in trends are likely forced by insolation changes due to axial precession (Lücke et al., 2020). Arctic amplification of the global cooling trend is evident. The tropics show no annual trend but increasing seasonal variations. Earth may have gained energy despite the millennial-scale cooling trend through reduced albedo in the tropics and subtropics, albeit offset by sea ice growth in the Amundsen Sea, while global-mean OLR remained constant. The outgoing LW trend in DJF and MAM has a horseshoe pattern, similar to the PDO-associated OLR pattern in Figure 5. The reflected SW trend around Antarctica may be due to sea ice growth. Also see Figure S3 below for ocean heat content and Figure S5 below for the spatially resolved equivalents.Figure 7Pseudoproxy experiments with realistic seasonal availability and noise levels, drawn from the CESM2 CMIP6 amip-piForcing simulation, which does not have the transient ERF, making it ideal for testing the temperature-dependent response. Top: global-mean anomalies (20-year lowpass-filtered). Bottom: annual correlations. The reconstruction shows skill in the temperature and outgoing LW radiation but is unable to faithfully track the reflected SW radiation, which is noisy on seasonal to annual timescales.
Future work
Validate the relationship between SAT and RSW/OLR encoded in the LIM by comparison to an atmosphere-only simulation prescribing the reconstructed SSTs. This simulation would determine the TOA radiation using a radiative transfer model instead of linear covariances.
Run the transient ERF simulations. These are needed to obtain the full EEI, particularly around volcano eruptions, which are the dominant forcing in the preindustrial period.
Estimate uncertainty due to the proxy network and the prior using Monte Carlo sampling. This includes creating LIMs that emulate other climate models to form a grand ensemble.
Validate the reconstruction against withheld proxies. This is the only rigorous validation method possible before the instrumental era.
Investigate physical mechanisms of low-frequency variability in TOA radiation, particularly cloud feedbacks. Compare radiation fields to orbital forcing due to axial precession, which changes the seasonal insolation.
Bibliography
Forster, P. M., Richardson, T., Maycock, A. C., Smith, C. J., Samset, B. H., Myhre, G., Andrews, T., Pincus, R., & Schulz, M. (2016). Recommendations for diagnosing effective radiative forcing from climate models for CMIP6. Journal of Geophysical Research: Atmospheres, 121(20). doi: 10.1002/2016JD025320
Franke, J., Frank, D., Raible, C. C., Esper, J., & Brönnimann, S. (2013). Spectral biases in tree-ring climate proxies. Nature Climate Change, 3(4), 360–364. doi: 10.1038/nclimate1816
Loeb, N. G., Wang, H., Allan, R. P., Andrews, T., Armour, K., Cole, J. N. S., Dufresne, J.-L., Forster, P., Gettelman, A., Guo, H., Mauritsen, T., Ming, Y., Paynter, D., Proistosescu, C., Stuecker, M. F., Willén, U., & Wyser, K. (2020). New Generation of Climate Models Track Recent Unprecedented Changes in Earth’s Radiation Budget Observed by CERES. Geophysical Research Letters, 47 (5), e2019GL086705. doi: 10.1029/2019GL086705
Lücke, L. J., Schurer, A. P., Wilson, R., & Hegerl, G. C. (2021). Orbital forcing strongly influences seasonal temperature trends during the last millennium. Geophysical Research Letters, 48(4). doi: 10.1029/2020gl088776
Perkins, W. A., & Hakim, G. J. (2021). Coupled Atmosphere–Ocean reconstruction of the last millennium using online data assimilation. Paleoceanography and Paleoclimatology, 36 (5). doi: 10.1029/2020pa003959
Supplemental figures
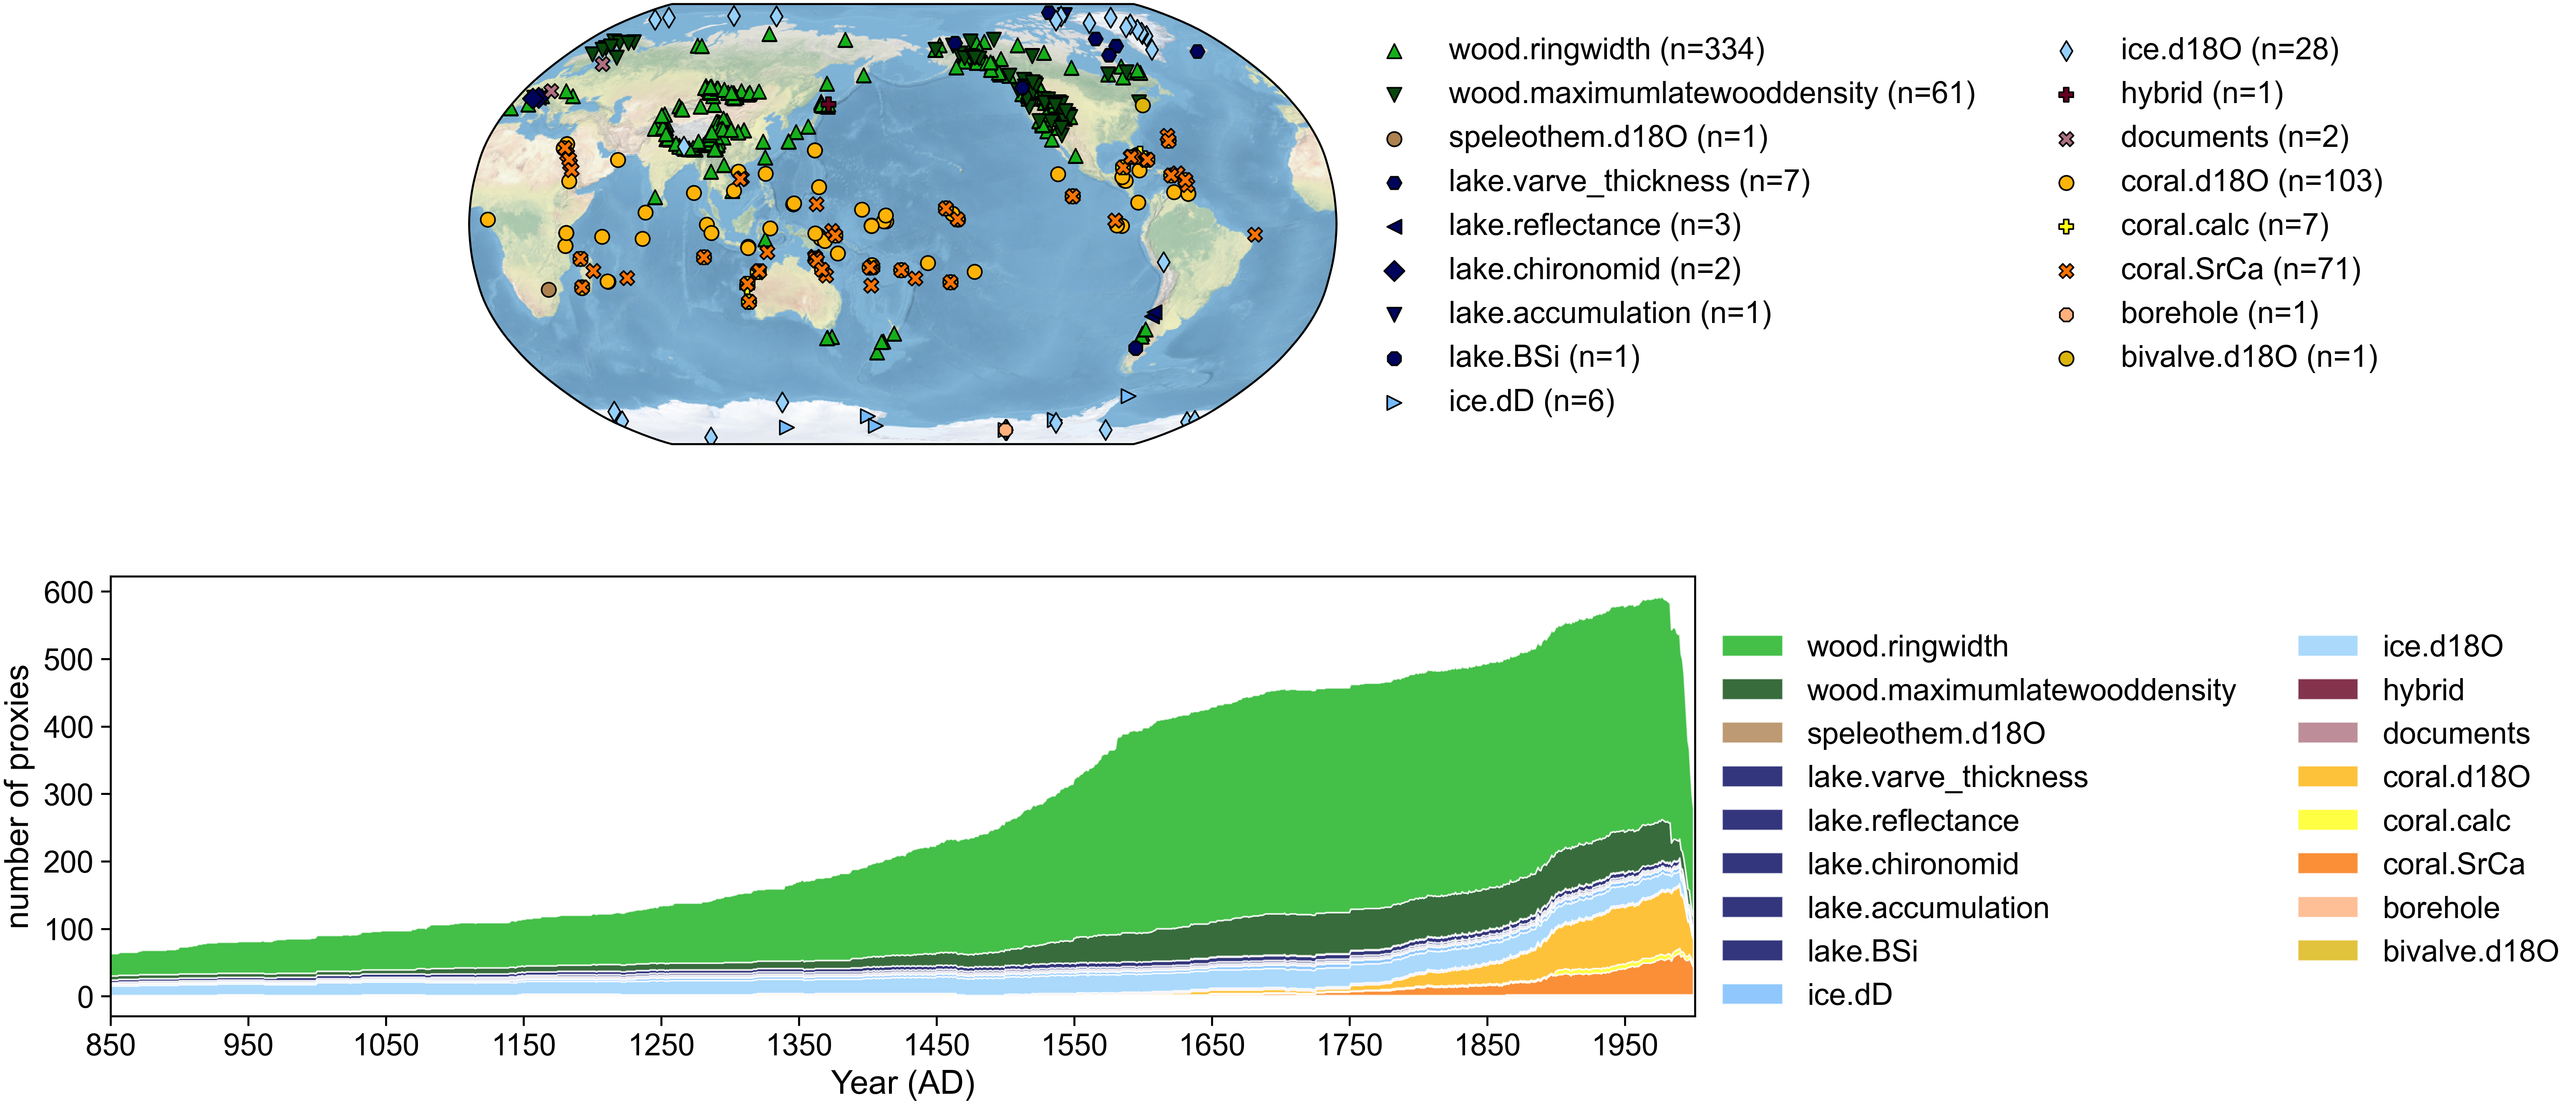
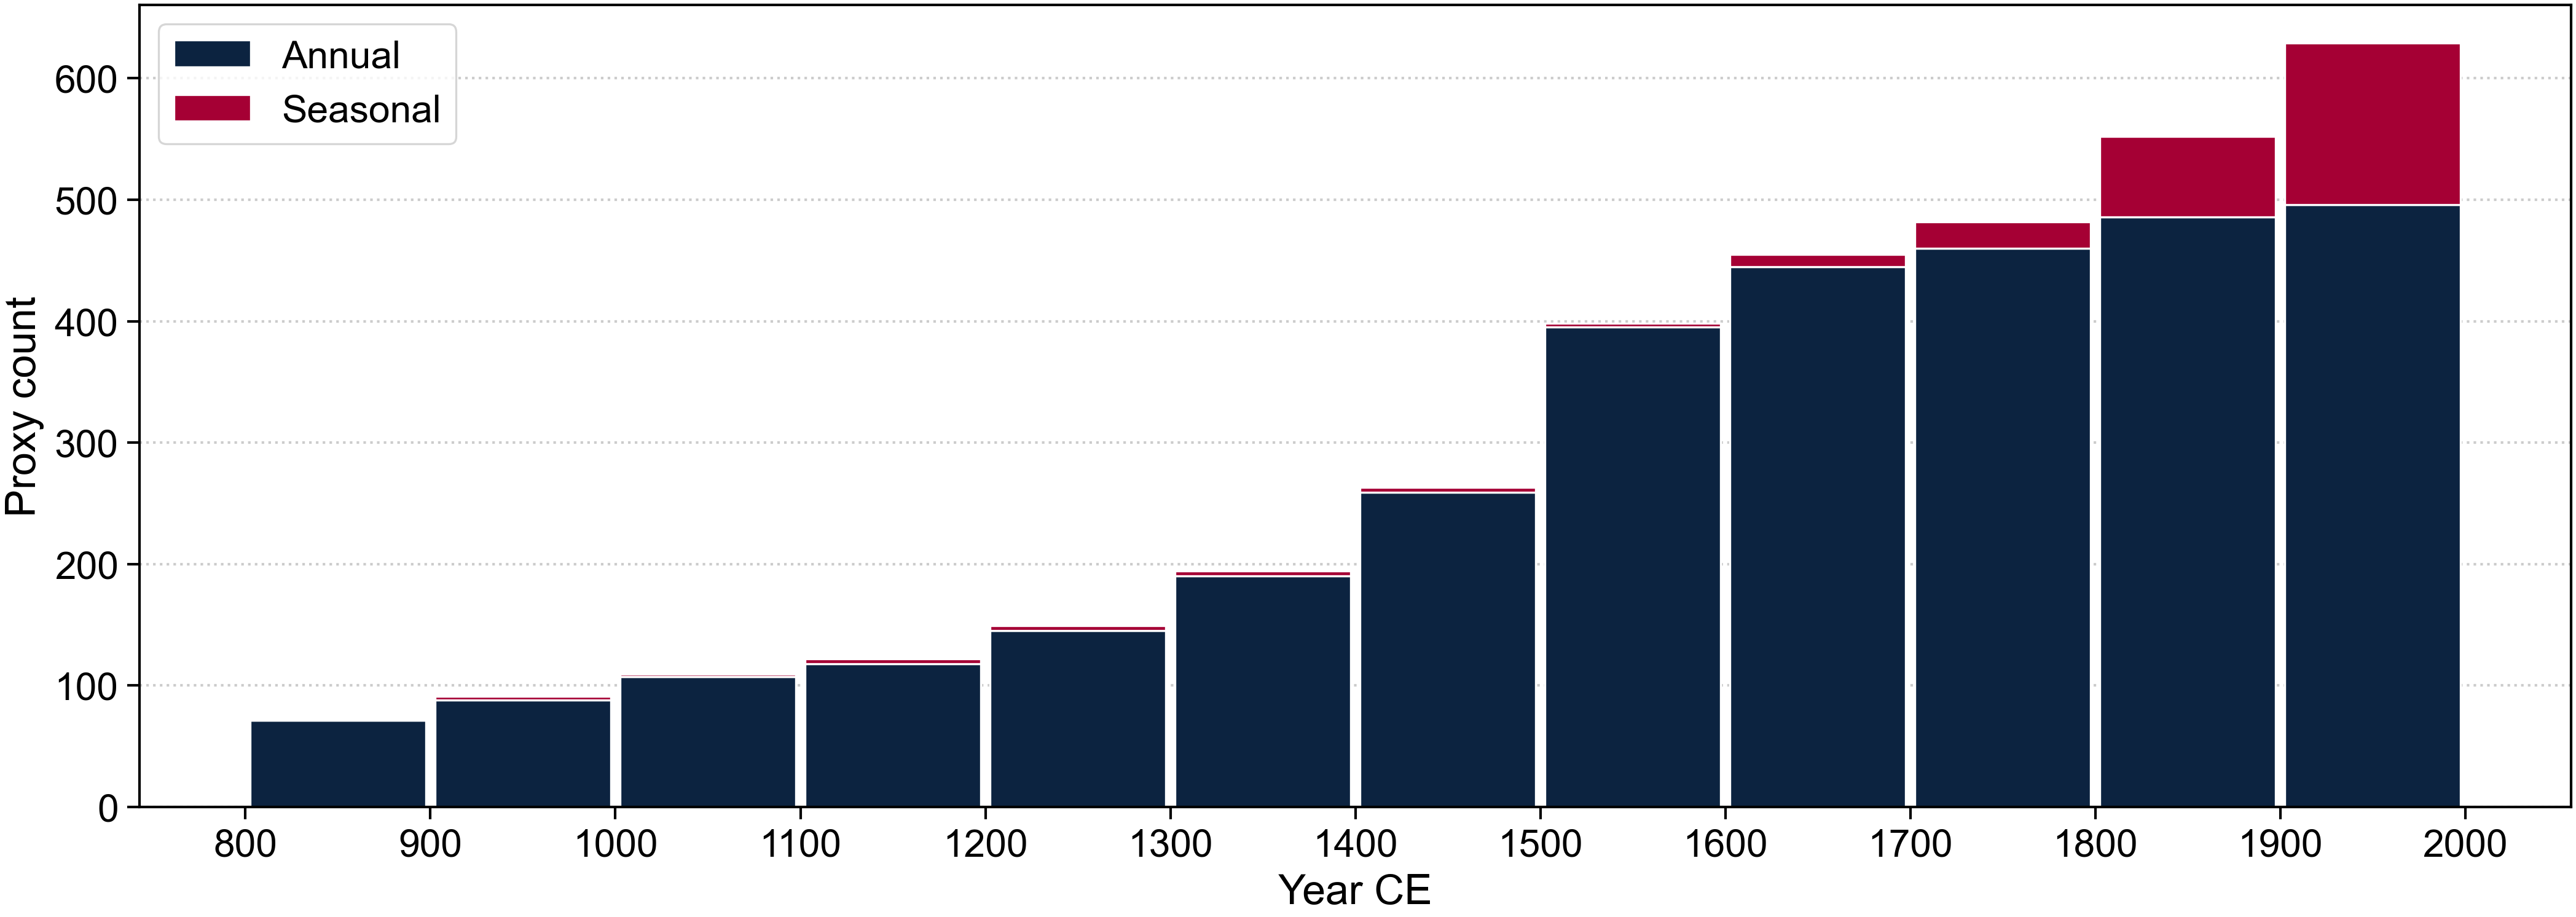
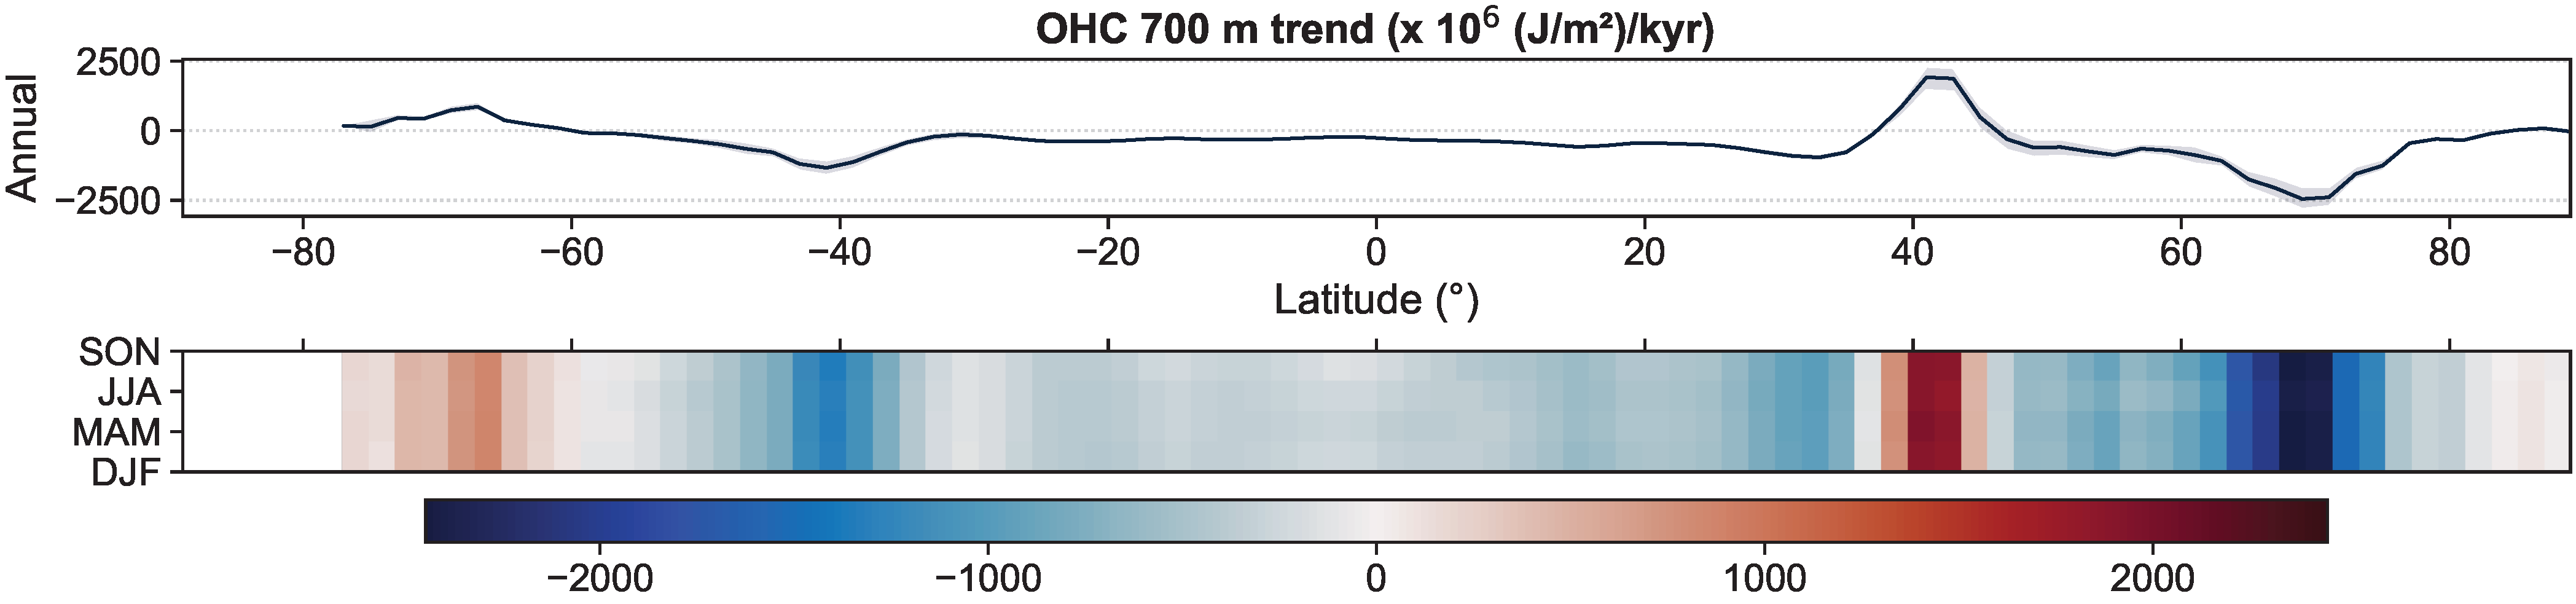
Figure S1Subset of PAGES2k and CoralHydro2k proxies that are used for the reconstruction. These 630 proxies were selected based on an overlap of at least 25 samples and a correlation of at least 0.05 with the instrumental calibration dataset (GISTEMP).Figure S2Availability of seasonally and annually resolved proxies. Most seasonally resolved proxies are corals, which are only available after 1600 CE (see Figure S1). Still, annually resolved proxies are sensitive to specific seasons (e.g., trees to their growing months) so that there is seasonal information throughout the last millennium. The LIM forecasting model bridges gaps of seasons with low proxy replication.Figure S3Millennial-scale trend in zonal mean of ocean heat content (upper 700 m) over 850–1850 CE. Also compare to Figure 6 above.Figure S4 Left: Power spectra of the global-mean surface temperature (GMST), Nino3.4 index and the Interdecadal Pacific Oscillation (IPO) tripole index over 850–1850 CE. Right: Regression of SST and OLR onto the filtered indices from our reconstruction at different passbands. OLR patterns differs qualitatively between PDO and AMO. Also compare to Figure 5 above.Figure S5 Millennial-scale trend over over 850–1850 CE. See Figure 6 for the zonally averaged equivalents.